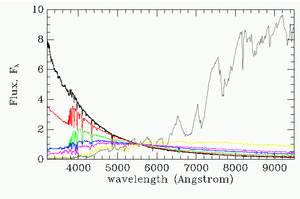
Stars are classified into spectral types depending on their colour and characteristics in their spectra, and are designated O,B, A, F, G, K and M. The properties of the stellar spectral types are shown in Table 2.1.
Young hot stars are blue, cool stars are red - as can be easily seen in the enormous difference in the amount of blue versus red light put out by stars of different spectra type. The peak in the energy distribution of O + B stars is well into the ultra-violet, while for M stars it is well into the infra-red (off to the left and right respectively on the lower scale). For G type stars like the Sun it peaks just about where our eyes are most sensitive to photons. Note that the spectral distributions shown above are for a star observed outside of the Earth's atmosphere - the atmosphere can change the distribution markedly in the UV and IR.
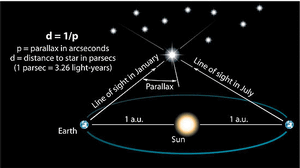
Distances to stars can be directly measured via the parallax effect, in which the position of the star changes slightly as the Earth moves around the Sun. This is the only direct method to measure the distance of stars.
Until the late 1980's only a few hundred stars had been measured accurately in this way, since the effect is very small and difficult to measure with ground based telescopes. The European Space Agency's Hipparcos mission revolutionised this field, measuring the parallaxes of some 120,000 stars, some 15,000 with an accuracy of better than 10%. Distances, D, allow the absolute magnitude MV of the stars to be determined using the apparent magnitude V
|
The apparent magnitude is a measure of the flux from the star as seen at the Earth in a particular pass-band (or filter). The simplest such system for optical light measures the flux in five filters termed U, B, V, R, I for ultra-violet, blue, visual, red and infra-red. The colour index of a star is defined by the logarithmic ratio of the flux in two filters
|
This leads to the Colour-Magnitude Diagram (or CMD) in which the colour of stars is plotted against their absolute magnitudes. The CMD of the Hipparcos stars for which the distances were measured to better than 15% is shown below:

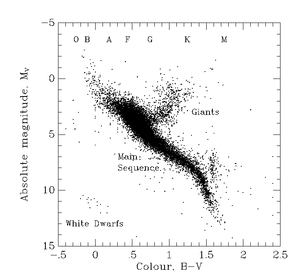
The spectral types are (very roughly) indicated at the top of the diagram. The broad sweep of stars from upper-left to lower-right is called the main sequence, and is the site of Hydrogen burning. After stars on the main sequence exhaust their fuel they move off the main sequence and become giants (most of the giants seen in the diagram would have been A-G main sequence stars up until a few million years ago), later ending up in the stellar graveyard as white dwarfs.
Ages can be measured for individual stars which have evolved slightly off the main sequence (where they have spent most of their lives) but not yet moved up the giant branch. This means F and G stars in practice - they are the only stars for which accurate ages can be obtained individually. Stars in groups however, where a range of stars masses have all formed at the same time, can be dated as a group. This is the case in open clusters and globular clusters.
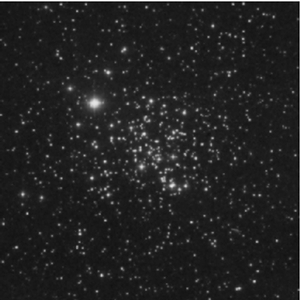

Most open clusters are young (less than 2 Gyr) and metal rich, move in circular orbits around the Galactic center. Globular clusters are mostly distributed around the Galactic disk in a spherical distribution, have large random velocities, no or very little net rotation around the Galactic center. A typical open cluster contains 100 to 1000 stars and is of order 1 to 10 pc in radius. There are about 105 open clusters in the Galaxy (a very loose number since the vast majority are hidden from view in the Galactic disk behind dust clouds, or lost amongst the foreground and background stars). A typical globular cluster contains 104 to 106 stars. These are much easier to find since they well away from the dust layer. There are about 150 known, and probably about 200 in total.
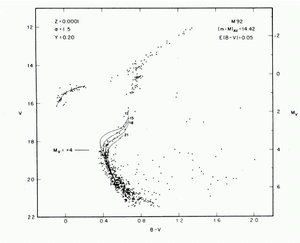
The key to aging a cluster is the colour-magnitude diagram. The colour of the bluest stars on the main sequence (called the main sequence turnoff) is directly related to the age of the cluster - the older the cluster, the redder the position of the turnoff.

Open cluster colour magnitude diagrams are typically beset with the problems that the clusters are contaminated with foreground and background stars, there are not many stars in the cluster anyway, and the amount of dust obscuration, metallicity and distance to the cluster have intrinsic uncertainties. Various ways around these difficulties have been developed, and most clusters can be dated to within ±30%.
There are much more stars in globular clusters, and deriving ages from isochrone fits is usually easier than in open clusters. The colour magnitude diagram for M92 is shown in figure 2.7. Four isochrones with ages of 12, 15, 18 and 21 Gyr are shown. Globular clusters are old, typically 12-15 Gyr.
|
Spectral | Temperature | Main sequence | Lifetimes | Comments |
| Type | range | mass range1 | (years) | |
|
O | 60,0080-30,000K | 20 - 120 | 105 - 106 | Hot, young and massive - and very short lifetimes. |
|
| often found in associations (loose groupings of stars) | |||
|
B | 30,000-10,000 K | 20 - 3 | 108 | Like O stars but less extreme |
|
A | 10,000-7,500 K | 3 - 1.5 | few ×109 | Typically younger than a few ×109 and part of the ``young disk'', |
|
| a thin layer of stars close to the Galactic plane | |||
|
F | 7,500-6,000 K | 1.5 - 1 | 1010 | Like A stars but longer lived, occupying a thicker layer in the |
| Galactic plane. Ages can often be measured for individual F and G stars | ||||
|
G | 6,000-5,000 K | 1 - 0.8 | few ×1010 | Long lived stars. G, K and M stars form the bulk of the Galactic disk |
|
K | 5,000-3,500 K | 0.8 - 0.5 | >1010 | Cool stars burning Hydrogen slowly. All K and M dwarfs formed during |
|
| the Galaxy's lifetime are still on the main sequence, | |||
| unlike hotter (OBAFG) stars | ||||
|
M | 3,500-2,000? K | 0.5 - 0.08 | >1011 | Very cool, dim stars, and very common. |
|
| Most of the stars in the Galaxy are M dwarfs. | |||
|
Brown | < 2,000 ? K | < 0.08 | >> 1011 | Only recently discovered, these are not actually ``stars'' |
|
Dwarfs | since they do not burn Hydrogen |