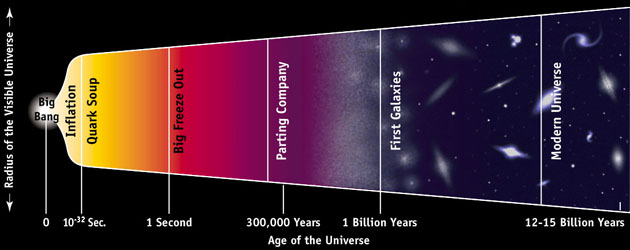
Step 2) Up to 10-35 seconds, quarks and anti-quarks dominate the Universe. The strong force separates from the weak and electromagnetic forces. Temperature drops to 1027 Kelvin. At 10-12 seconds the four forces become distinct.
Step 3) At 0.01 seconds, electrons and positrons form as the temperature drops to 1011 Kelvin. After 1 second, the Universe becomes transparent to neutrinos, which from now on hardly interact further with matter.
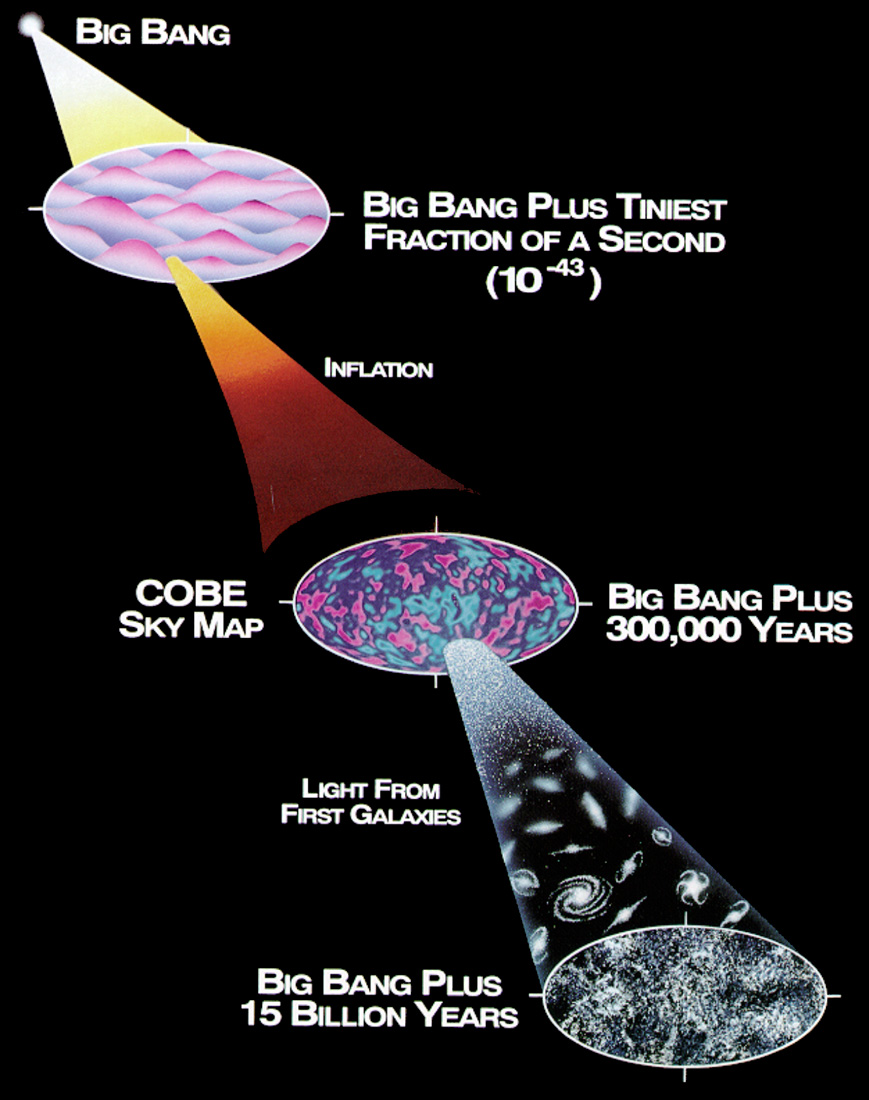
Step 4) At three minutes after the big bang, the temperature has reached 109 K, protons and neutrons combine to form what will become the nuclei of elements mostly H and He). After 300,000 years the temperature has dropped to 3000 K and the electrons are captured by nuclei to form neutral atoms. The Universe becomes transparent to light (photons stop interacting with free electrons) resulting in the formation of the Cosmic Background Radiation.
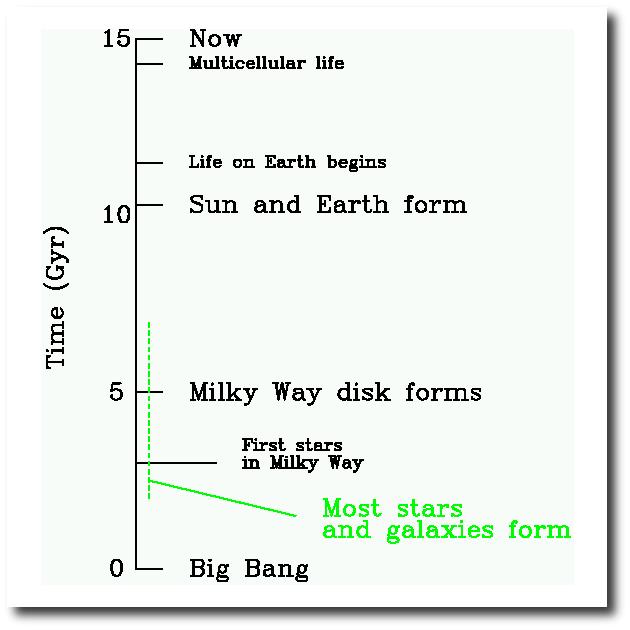
Step 5) After 1 billion years, the temperature is 20 K and galaxies and stars have begun to form via gravitational contraction of over-densities in the initial Universe. Af a few billion years our Galaxy forms, at about 10 billion years after the Big Bang the Sun and Earth form. After 15 billion years we reach the present and a background temperature of about 3 K.
Adapted from "Steven Hawking's Universe" http://www.pbs.org/wnet/hawking/universes/html/univ.html
About 300,000 years after the Big Bang, there was the era of recombination in which protons and electrons combined to form neutral Hydrogen. At this point, baryonic matter in the Universe consisted of about 75% Hydrogen and 25% Helium (by mass), with some small amounts of heavy elements (elements starting from Lithium). The distribution of this material was very close to, but not quite, uniform. These slight over- and under-densities were observed for the first time by the COBE satellite (launched in 1989) and amount to only a few parts in 100,000. The variations were mapped out over the whole sky, shown in the next figure, on scales of greater than about 7 degrees.

After recombination, the Universe entered a period called the "Dark Ages", until gravitational attraction had operated on very slight overdensities in the matter distribution, leading to the formation of light emitting stars and galaxies. Did the formation of early stars and galaxies take place "top-down" or "bottom up"? i.e. did the stars form first and get together to form galaxies? Or did the gas collect together into galaxy like objects first and then develop stellar structure? Most people would answer "bottom-up" these days -- the HST images of lumpy galaxies in the distant universe seem to suggest that galaxies formed from many sub-units. The development of stars and other sources of light meant the Universe was optically observable again!
Exactly how stars and galaxies
formed, when the process started and how long it took is currently a major
area of research. A simple picture runs like this: about 1 billion
years after the big bang the first star forming regions, conglomerates
of perhaps 106 to 109 solar masses began to develop.
Over the next several billion years, most of these merge to form larger
units or are partially destroyed by the energetic supernovae which develop
as a natural part of star formation. Within a few billion years most of
these have developed into stable configurations of stars and gas and are
recognisable as "galaxies".
The faintest galaxies so far observed were seen in the "Hubble Deep Field", a tiny patch of sky which was imaged for more than a week by the Hubble Space Telescope. Part of this image is shown below ---
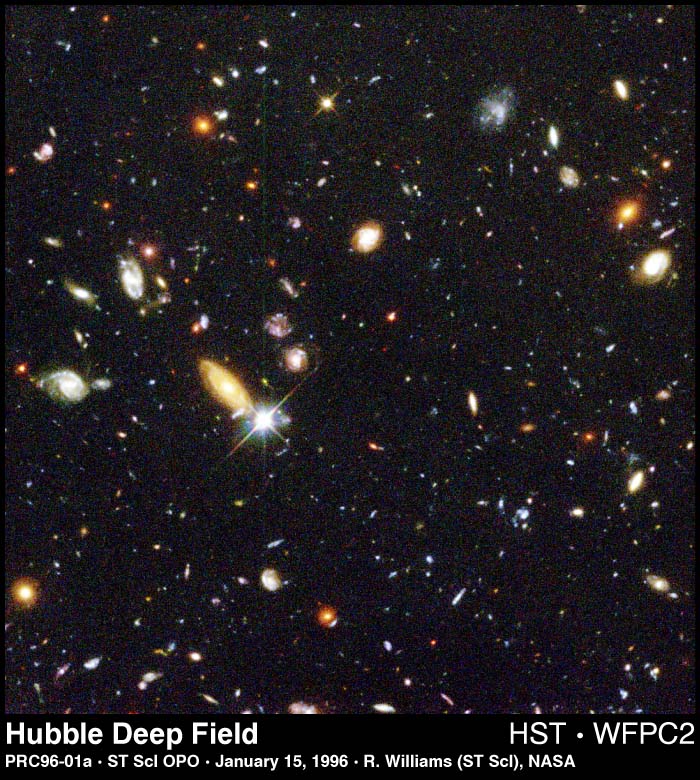
Galaxies have been identified in this image with redshifts which indicate that the light reaching us has been travelling for about 90 percent of the age of the Universe --- or about 12-15 billion years. One such galaxy is shown below --- this must have been amongst the very first galaxies (and the stars in it) which formed ...
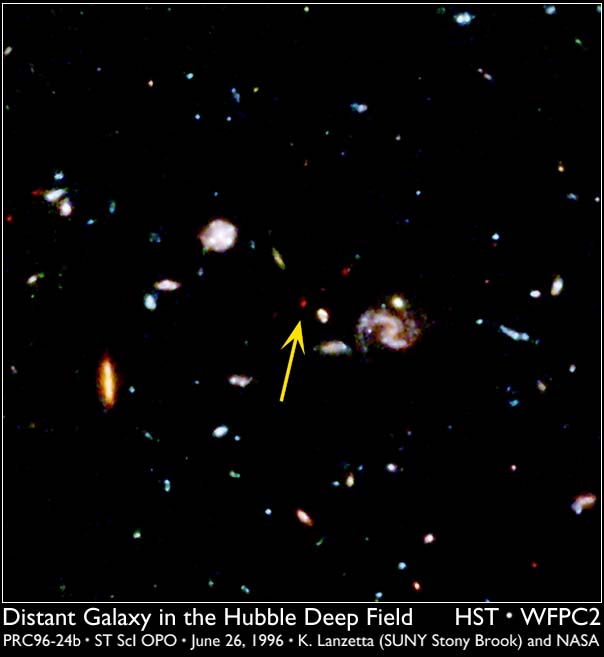
These galaxies are at present too few in number and too faint to be study in the kind of detail which we would like --- to allow us to answer basic questions concerning exactly when and and what conditions the stars formed. However, a new generation of 10 meter class telescopes is currently coming on line all around the world so these issues are among those which these telescopes will concentrate.
The last 10 billion years
or so of the developments in galaxies and in their stellar content
is now quite well studied because of the
Hubble Space Telescope,
which was able to obtain clear images of these distant galaxies for the
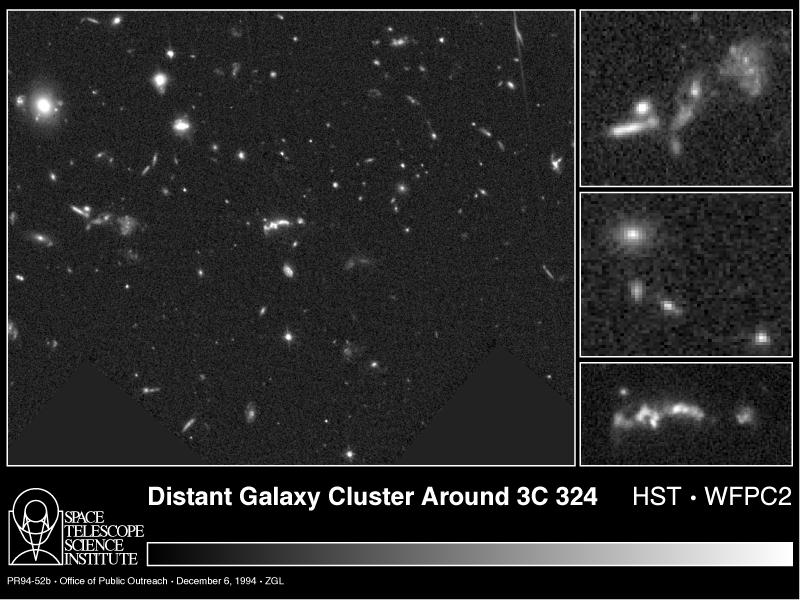
first time. The following picture shows early galaxies in the (confused)
process of forming. One shouldn't forget that these knots of light
are due to billions of stars forming, more or less at the same time...
A sequence of galaxy images as a function of time runs like this :
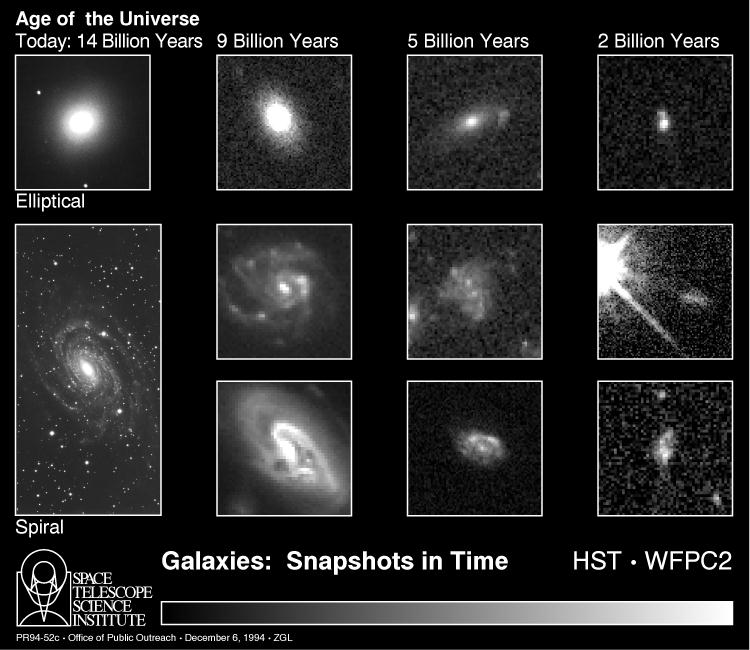
The general picture is that
galaxies have been forming over quite a few billion years, are continuing
to form and develop still, and seem to have been assembled from many smaller
sub-galaxies.
Probably most of the "mature"
galaxies we see around us now originate from this epoch 10-12 billion years
ago. Classically (20 years ago) it was considered that most or all
galaxies had formed at this time. However, several studies now show that
galaxy formation is an on-going process, but at a much reduced rate. The
plot below is a recent estimate of the rate at which stars have formed
(in galaxies) over the lifetime of the Universe.
The distribution of galaxies in space around us in the nearby Universe is currently a very active research area. Recent surveys have revealed a very detailed foamy structure in which galaxies are found along "walls" surrounding large "voids" which are relatively galaxy free. The precise form of this distribution places interesting constraints on the type of Universe we inhabit --- its total mass, expansion rate and ultimate fate.
Source:
http://www.seas.columbia.edu/~ah297/un-esa/universe/universe-chapter5.html
Encyclopedia of Applied Physics, Vol. 23 (Page 47 - 81), 1998 WILEY-VCH
Verlag GmbH, ISBN: 3-527-29476-7
Margaret J. Geller, John P. Huchra, Luis A. N. da Costa, and Emilio
E. Falco, Smithsonian Astrophysical
Observatory © 1994
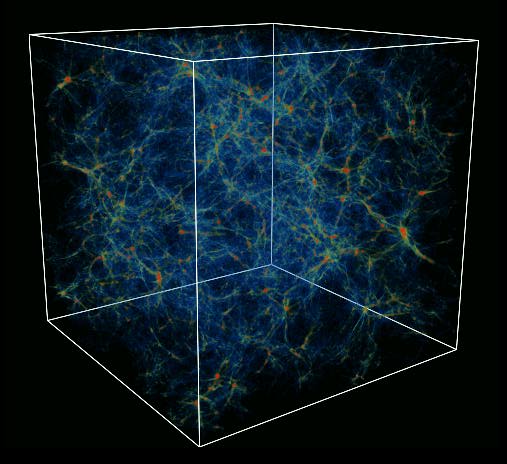
Surveys like the one above map the local Universe by measuring the position in 3-D space of galaxies up to a few hundred Mpc away. The observable Universe has a diameter of order 10 Gpc. To find and observe galaxies at large distances (and therefore in the early Universe) requires large or special telescopes. The formation of galaxies is not well understood, although the field is beginning to open up. The figure above shows the start of the art at present, in which galaxies have formed in a computer simulation of the gravitational collapse of the initial perturbations which came from the big bang. The simulations are difficult to compute because the effects of gas dynamics and star formation in the forming galaxies is very poorly understood.
Nearby galaxies can be very
usefully classified as spiral, elliptical or irregular.
Our own galaxy is a spiral
galaxy; so is the Andromeda Galaxy (M31), and the Whirlpool Galaxy (M51).
 |
 |
© Anglo-Australian Observatory
Source http://www.aao.gov.au/images.html
All spiral galaxies have
flat, rotating disks
central bulges
gas and dust in the disk
star formation in spiral arms
A ``subspecies'' of spiral
galaxy is the class of barred spirals. In a barred spiral galaxy, the spiral
arms wind away from an elongated central bar rather than from a spherical
central bulge.
 |
 |
© Anglo-Australian Observatory
Source http://www.aao.gov.au/images.html
Elliptical galaxies are actually the most common type of galaxy. Randomly select a large number of (nearby -- within a few 100 Mpc) galaxies. On average, you will find:
60% elliptical
20% spiral
20% irregular
Elliptical galaxies contain very little gas and dust, and the gas that is present is very hot and diffuse. Consequently, there is no current star formation in elliptical galaxies. The stars in elliptical galaxies are old (termed "Population II") stars. Unlike the disks of spiral and S0 galaxies, elliptical galaxies are NOT rotating rapidly.
Elliptical galaxies have
a very large range of sizes. Both the largest and smallest galaxies in
the universe are elliptical. Giant elliptical galaxies contain 1 trillion
stars or more. Dwarf ellipticals contains 10 million stars or less.
 |
 |
© Anglo-Australian Observatory
Source http://www.aao.gov.au/images.html
 |
 |
© Anglo-Australian Observatory
Source http://www.aao.gov.au/images.html
The gas, stars and dust content of the galaxy types mentioned above may not be the final word. For example, one recently discovered spiral galaxy consists almost entirely of gas with a very tiny central region containing stars. It is worth keeping in mind that there are probably still a few surprises out there.
This image shows the radio and optical maps overlayed for the galaxy NGC 2915. Blue is the radio map, yellow is the optical. This is probably a "failed" galaxy which has not (yet) turned from gas to stars.
Source
http://www.atnf.csiro.au/~bkoribal/n2915.html
Gerhardt Meurer (Johns Hopkins University)
Further superb images of Galaxies sorted by type can be found at the Anglo Australian Observatory (http://www.aao.gov.au/local/www/dfm/galaxies.html).
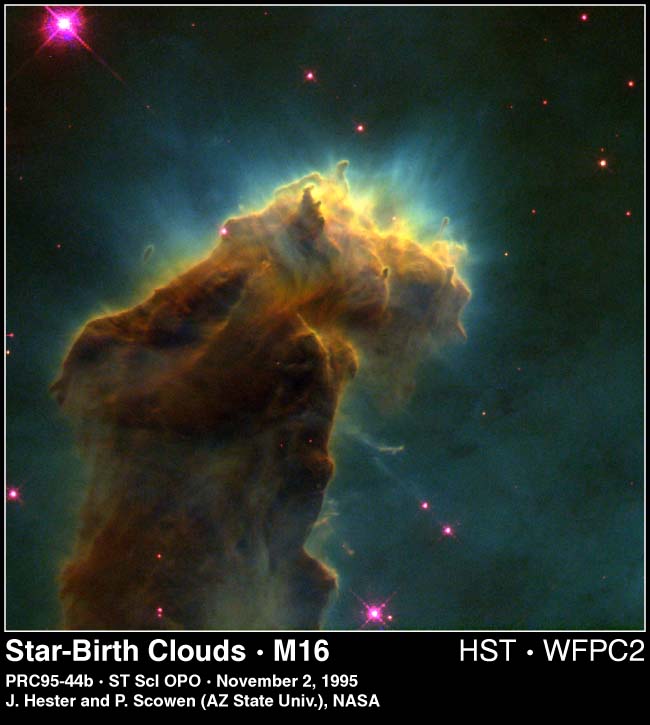
Hubble has revealed higher
resolution images of star forming regions, which at least show some of
the complexities of the physical processes involved...
 |
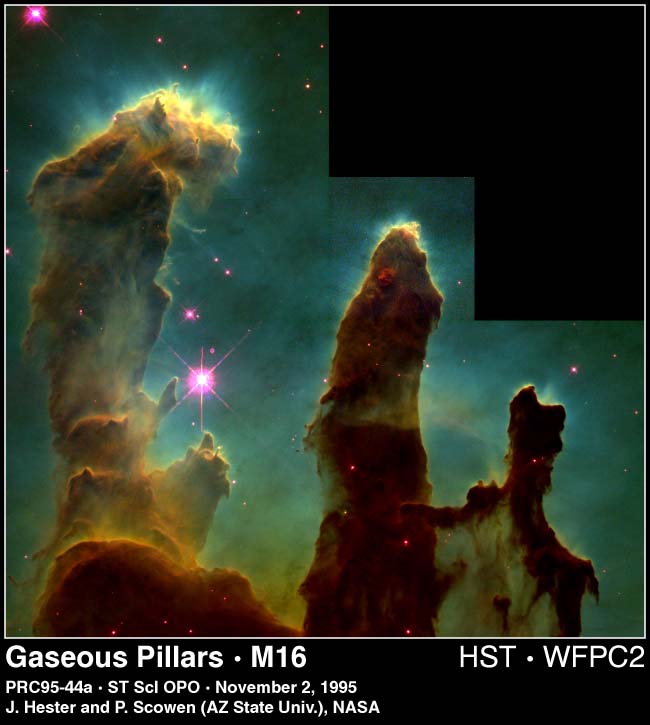 |
The pictures above show columns
of cool interstellar hydrogen gas and dust that are also incubators for
new stars. The
pillars protrude from the
interior wall of a dark molecular cloud like stalagmites from the floor
of a cavern. They are part of the "Eagle
Nebula" (also called M16),
a nearby star-forming region 7,000 light-years away in the constellation
Serpens. The pillars of gas are dense gas which has survived being "eroded"
away by the light of hot UV stars nearby, and the small blobs are even
denser regions where it is very likely that stars themselves are actually
forming. They'll emerge from the cocoons in which they are incubating millions
of years rom now, and for the moment are so heavily shrouded by dust that
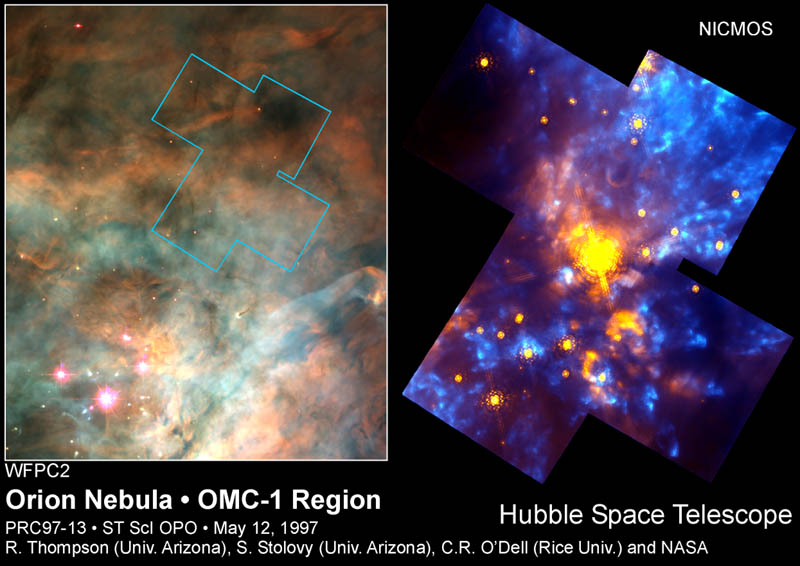
we cannot see them at all with optical light. Infrared light (heat) which
does escape from the regions is the main clue that energetic processes
are taking place. The image below shows how different imagesin optical
(on the left) and infrared (on the right) taken of the same region in the
Orion Nebula can be.
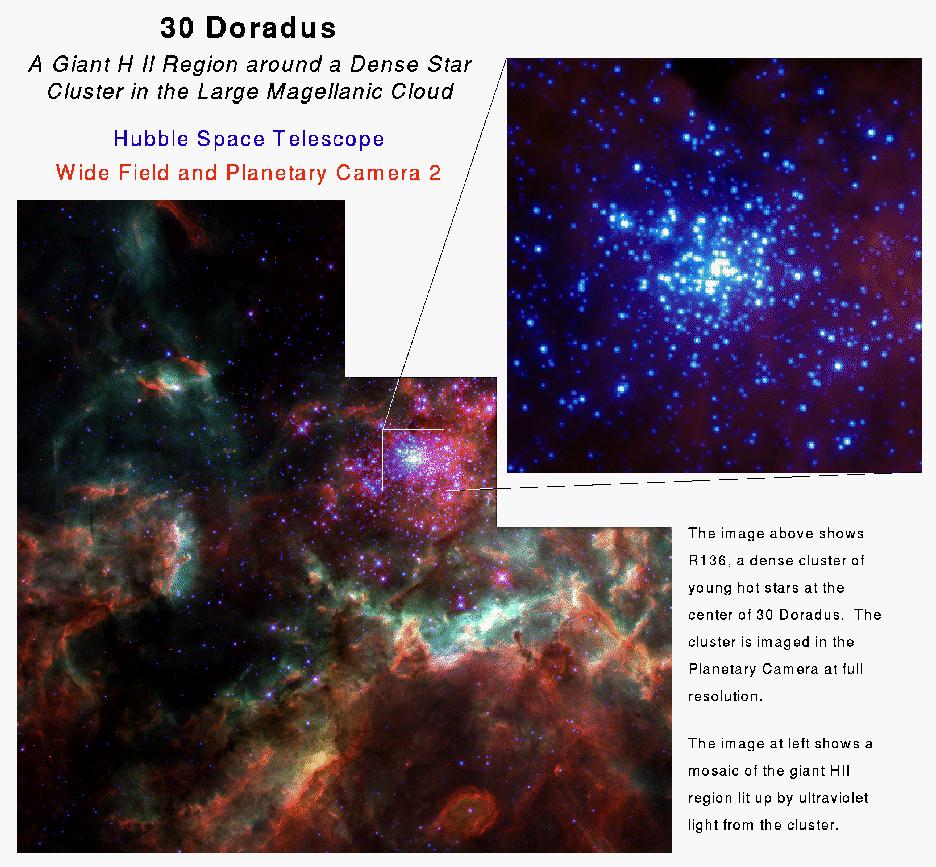
The star forming regions can be very large, sometimes occuping a major section of an entire galaxy, such as seen in the image below ---
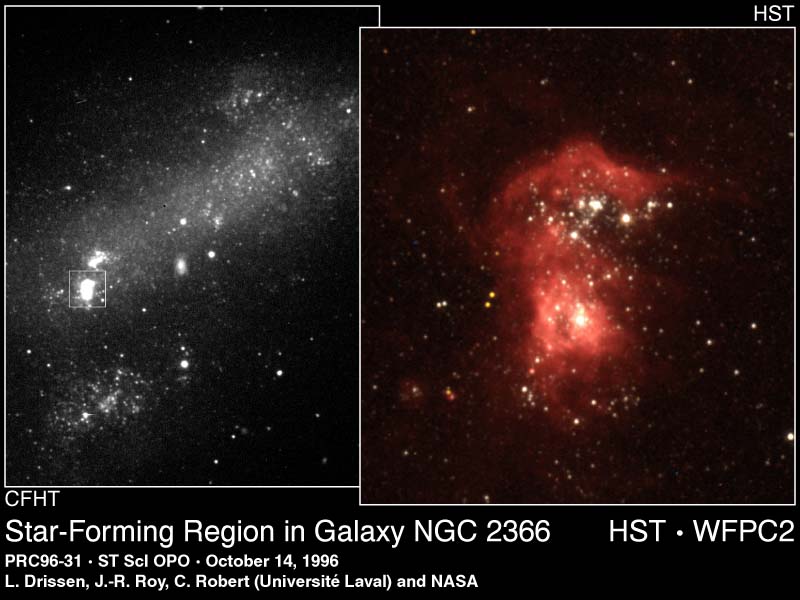
Out of these star forming regions star eventually emerge --- often "en mass" in giant clusters of up to a million stars at once...
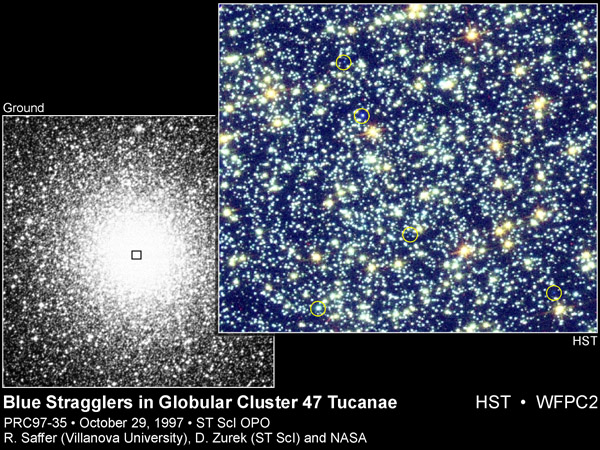
Clusters of stars which we can see forming like this might end up as what we know today as "globular clusters" of our own Galaxy --- millions of stars tightly bound by their own gravity which have survived from the earlist times when our galaxy was forming. The image below shows the globular cluster 47 Tuc, a naked eye object in the Southern Hemisphere, and a zoomed in view taken with the Sapce Telescope of the central regions. Space Telescope was actually capable of resolving the individual stars for the first time (they are too closely packed to resolve individually from ground based telescopes).
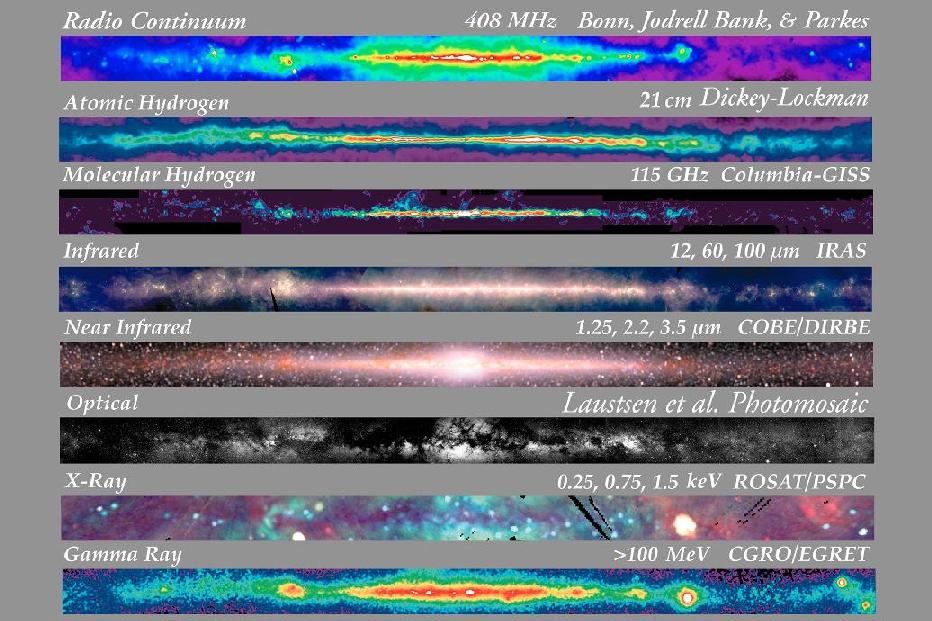
Source http://adc.gsfc.nasa.gov/mw/milkyway.html
The images above show views
of the Milky Way along the Galactic plane over wavelengths from Radio to
Gamma.
 |
Radio map at 408 Mhz, showing mainly emission due to scattering of free electrons in the interstellar plasma (i.e. hot gas). The large arc is due to a nearby supernova remnant. |
 |
21 cm radiation map, showing the distribution of neutral Hydrogen gas in the galactic disk, and a few nearby arcs from recent supernovae. |
 |
Distribution of H2, or molecular Hydrogen.This maps the "cold" gas in the Galaxy, from which stars will eventually form. The actual observed molecule is CO, rather than H2, which is very difficult to detect directly. The star forming layer of gas is remarkably thin. |
 |
Infrared maps at the wavelengths 12, 60 and 100 microns. Infrared emission predominately comes from interstellar dust which is "warmed" to a f ew 10s of degrees Kelvin by the ambient radiation field of the Galaxy's stars. |
 |
Near Infrared emission is dominated by cool stars. Since these are typically either old or long-lived stars, this is our best view of the Galaxy with the hot, bright young stars removed. Dust absorption at these wavelengths is very low and we get a clear view all the way to the Galactic center of the disk and bulge. |
 |
Optical imageof the Galaxy showing the huge effects that dust absorption has on our view of the central regions of the Galaxy. The emission is dominated by young and old stars and by the effects of dust. |
 |
X-ray image taken by the Rosat satellite. This view, less clear than the others is dominated by supernova remnants (some of the arclike features) as well as individual sources of X-radiation from close binary stars or black hole candidates. |
 |
Egret's Gamma ray view of the Galaxy is dominated by emission from Cosmic Rays (high energy particles) decelerating in the interstellar medium. |
| Spectral Type | Temperatute range | Mass range on the Main Sequence | Lifetimes | Comments | |
| O | 60,000-30,000K | 20 - 120 MO | 105 - 106 years | Hot, young and massive - shortest lifetimes, found in young stellar associations | |
| B | 30,000-10,000 K | 20 - 3 MO | 108 years | Like O stars but less extreme; longer lived, less luminous | |
| A | 10,000-7,500 K | 3 - 1.5 MO | 0.5-1x10⁹ years | Typically younger than a few x109 years, part of the "Young disk", a thin layer of stars close to the Galactic plane | |
| F | 7,500-6,000 K | 1.5 - 1 MO | 1010 years | Like A stars but longer
lived.
Ages can often be measured for individual F and G stars |
|
| G | 6,000-5,000 K | 1 - 0.8 MO | few-1010 years | Long lived stars. G, K and M stars form the bulk of the Galactic disk | |
| K | 5,000-3,500 K | 0.8 - 0.5 MO | >1010 years | Cool stars burning Hydrogen slowly. All K and M dwarfs formed during the Galaxy's lifetime are still on the main sequence, unlike hotter (OBAFG) stars | |
| M | 3,500-2,000? K | 0.5 - 0.08 MO | >1011 years | Very cool, dim stars, and very common. Most of the stars in the Galaxy are M dwarfs. | |
| Brown Dwarfs | < approx 2,000 K | < 0.08 MO | >>1011 years | Only recently observed, these are not actually "stars" since they do not burn Hydrogen | |
The different spectral types reflect the temperature/mass of the stars. The relative flux distributions as a function of spectral type is shown below. The colours represent : O stars - black, B stars- red, A stars- green, F stars - blue, G stars - purple, K stars - yellow and M stars - grey. (N.B. All spectra normalised to 1.0 at 5500 Angstroms).
Source
http://www.ifa.hawaii.edu/~pickles/hilib.html, (A.J. Pickles, PASP 110,
863, 1998)
Young hot stars are blue,
cool stars are red -- as can be easily seen in the amount of blue versus
red light put out by stars of different spectra type. The peak in the energy
distribution of O + B stars is well into the ultra-violet, while for M
stars it is well into the infra-red (off to the left and right respectively
on the lower scale). For G type stars like the Sun it peaks just about
where our eyes are most sensitive to photons. Note that the spectral distributions
shown above are for a star observed outside of the Earth's atmosphere ---
the atmosphere can change the distribution markedly in the UV and IR.
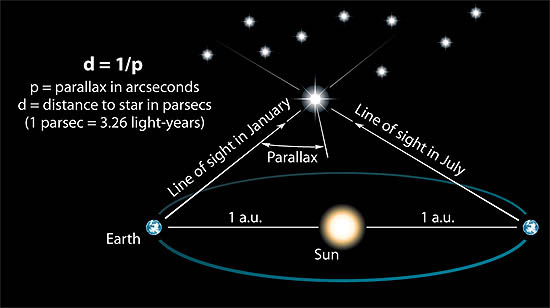
Distances to stars can be
directly measured via the parallax effect, in which the position of the
star changes slightly as the Earth moves around the Sun.
This is the only direct
method to measure the distance of stars.
Until the late 1980's only a few hundred stars had been measured accurately in this way, since the effect is very small and difficult to measure with ground based telescopes. The European Space Agency's Hipparcos mission revolutionised this field, measuring the parallaxes of some 120,000 stars, some 15,000 with an accuracy of better than 10%. Distances, D, allow the absolute magnitude MV of the stars to be determined using the apparent magnitude V
MV = V - 5 log (D) + 5
The apparent magnitude is a measure of the flux from the star as seen at the Earth in a particular pass-band (or filter). The simplest such system for optical light measures the flux in five filters termed U, B, V, R, I for ultra-violet, blue, visual, red and infra-red. The colour index of a star is defined by the logarithmic ratio of the flux in two filters
B - V = 2.5 log(Flux in B/Flux in V)
This leads to the Colour-Magnitude
Diagram (or CMD) in which the colour of stars is plotted against
their absolute magnitudes. The CMD
of the Hipparcos stars for
which the distances were measured to better than 15 % is shown below:
The spectral types are (very
roughly) indicated at the top of the diagram. The broad sweep of
stars from upper-left to lower-right is called the main sequence,
and is the site of Hydrogen burning. After stars on the main sequence exhaust
their fuel they move off the main sequence and become giants (most
of the giants seen in the diagram would have been A-G main sequence stars
up until a few million years ago), later ending up in the stellar graveyard
as white dwarfs.
Start gnuplot by clicking on the icon or typing gnuplot.
| plot out a function | gnuplot> plot sin(x) | |||
| plot with some parameters set | gnuplot> plot f(x) = sin(x*a), a = .2, f(x), a = .4, f(x) | |||
| plot with x and y axis limits | gnuplot> plot [t=1:10] [-pi:pi*2] tan(t) | |||
| set range of X-axis | gnuplot> set xrange [1:10] | |||
| set range of Y-axis | gnuplot> set yrange [-pi:pi] | |||
| plot out a parabola |
|
|||
| plot data from a file (columns 2 and 3 -- column 2 on the x-axis, 3 on the y-axis) | gnuplot> plot 'fig5.dat' using 2:3 | |||
| define a 2-D function | gnuplot> f(x,y) = x**2+y**2 | |||
| plot a 2-D function | gnuplot> splot f(x,y) | |||
| same with ranges set | gnuplot> splot [x=-5:5] [y=-5:5] [0:200] f(x,y) | |||
| define X-axis label | gnuplot> set xlabel "radius [r/R]" | |||
| define Y-axis label | gnuplot> set ylabel "temperature [T/Tc]" | |||
| read commands from a file | gnuplot> load "linear.gp" | |||
| plot several functions | gnuplot> plot p(x),t(x),m(x) |
| Example input file
t(x) = 1.0 + x - (19.0/5.0)*x**2 + (9.0/5.0)*x**3 p(x) = 1.0 - (24.0/5.0)*x**2 + (28.0/5.0)*x**3 - (9.0/5.0)*x**4 m(x) = 4.0*x**3 - 3.0*x**4 |
Here are some links to the files you need for the windows version of gnuplot: