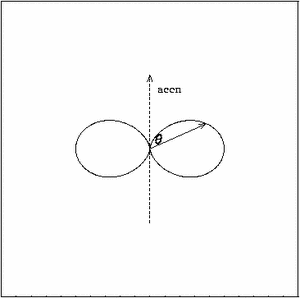
A charged particle undergoing an acceleration radiates photons. A ready example of this is when electrons moving back and forth in antennae produce electromagnetic radiation, such as transmitted by radio stations.
The power in electromagnetic radiation emitted by a particle of charge q with an acceleration a is given by Larmor's formula
| (1) |
The radiation has some very interesting properties:
|
where q is the angle between the direction of the acceleration and the emission. Thus there is no emission along the acceleration vector and maximum emission takes place perpendicular to the acceleration vector (see figure 3.1).

Bremsstrahlung, or braking radiation, is emitted by a charged particle moving in an electric field, E. The particle emits energy in the form of electromagnetic radiation, at the expense of its kinetic energy, hence the name ``braking radiation''.
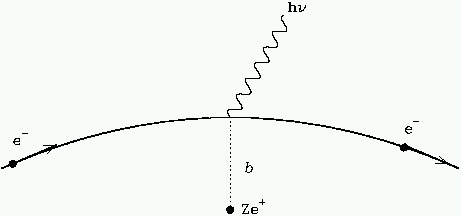
The major astrophysically relevant example of bremsstrahlung, is when an an electron, e- with velocity v, passes a charge consisting of Z protons, with total charge Ze+. The impact parameter b of the interaction is the distance of closest approach (c.f. Figure 3.3).
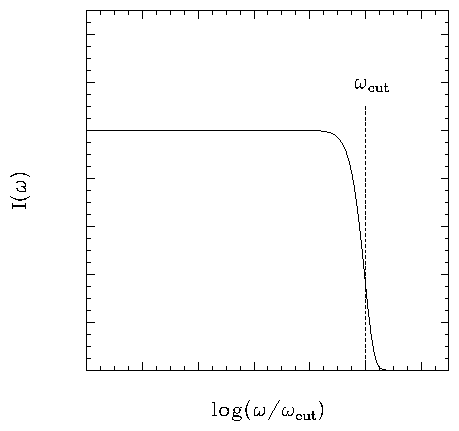
The electron is accelerated during its interaction, and since the acceleration is not uniform it emits photons with a range of wavelengths, i.e. a spectrum. The power emitted can be computed from Larmor's formula after the acceleration as a function of time has been determined, with the result that a flat spectrum in frequency with an upper cutoff wcut), which is related to the interaction time, Dt = v/b, or interaction frequency w = 1/Dt = b/v, is produced.
The intensity in the flat part of the spectrum, where (w < wcut) is given by
| (2) |
The expressions above characterise the emission of a single electron, with impact parameter b and velocity v. We would now like to generalise the results to a population of electrons with a certain velocity and density distribution. An astrophysically useful case is for a population with a uniform temperature T. The total emission by all particles in this population is called thermal bremsstrahlung.
Consider an cloud of ionised gas with a characteristic temperature T. The velocity distribution of the particles in this cloud is given by the Maxwell distribution:
| (3) |
The typical impact parameter b in the cloud, between the electrons and positive ions is set by the number density of the electrons, ne, and the number density of the ions ni. If we integrate the expression in eqn 3.2 over velocity, v and impact parameter b, one obtains the total emitted power eff in the cloud per unit volume:
| (4) |
this spectrum cuts off in n at approximately hn/kT, so the cutoff is a useful means of determining the temperature of the cloud. The subscript ``ff'' refers to the term free-free, which is also frequently used to denote this kind of emission (the electrons and protons are moving freely in the interaction - i.e. they are not ``bound'' into some other system). The expression includes a term, gaunt factor, gff which is of order unity over a wide range of temperature and density conditions.
In cgs units the power emitted per cubic cm is
| (5) |
Here, gB is the frequency averaged gaunt factor for the thermal distribution of velocities, and is of order unity.
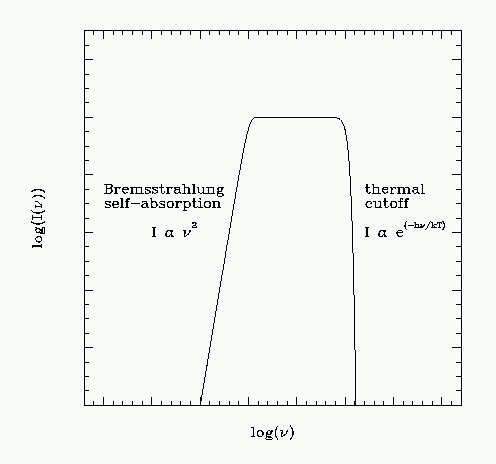
The spectrum shown in figure 3.2 is correct as long as the medium producing the radiation is optically thin. In a medium which is optically thin, any internally generated radiation is essentially free to escape from the emitting region without further interaction with the medium. If the medium is optically thick, radiation generated is only moving a short distance within the medium (relative to its size) before being absorbed again - the shape of the spectrum is set by the balance of both emission and absorption processes. In an optically thick region, this amounts to constraining the spectrum to be not more efficient than a black body. Consequently, the spectrum turns over at low frequency a drops with a power-law dependence identical to the drop-off in intensity at low frequency seen in the Raleigh-Jeans part of the blackbody spectrum (figure 3.4).
In astrophysics, bremsstrahlung radiation indicates the presence of an ionised gas or plasma. Astrophysical examples include thin plasmas such as in stellar atmospheres, hot and dense plasma such as occurs in the central regions of active galactic nuclei (AGN) or other objects which are accreting matter. HII regions, in which the gas surrounding a hot star is ionised by the UV photons from the star can show bremsstrahlung emission from the optical to the radio region. Galaxy clusters are sources of X-ray bremsstrahlung, an important source of evidence for the existance of dark matter.
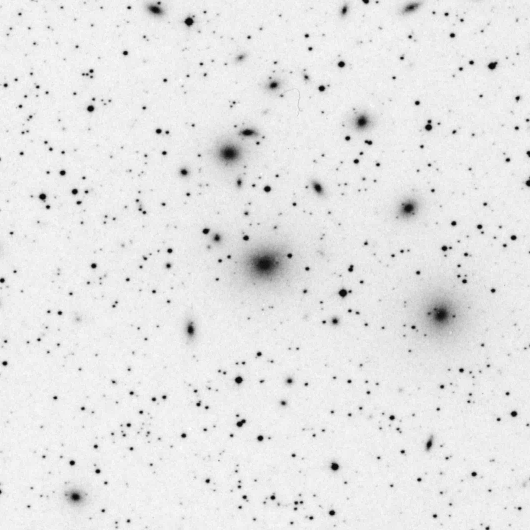
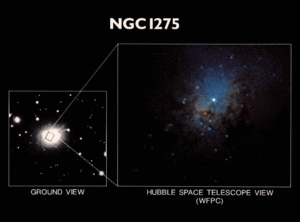
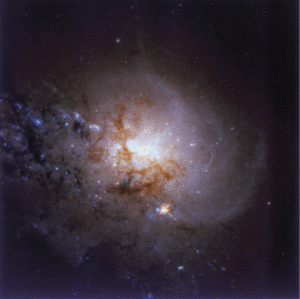
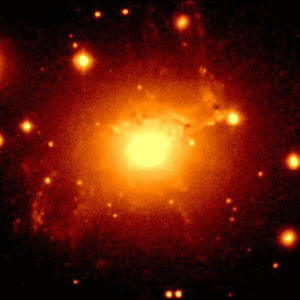
Perseus is a large cluster of galaxies in the Northern hemisphere. It is about 100 Mpc away and contains thousands of galaxies embedded in a hot halo of gas. The central galaxy appears to be in the process of collision with a spiral galaxy, and has itself probably been built up by accretion of many smaller galaxies. Optical images at various scales are shown in figures 3.5, 3.6, 3.7.
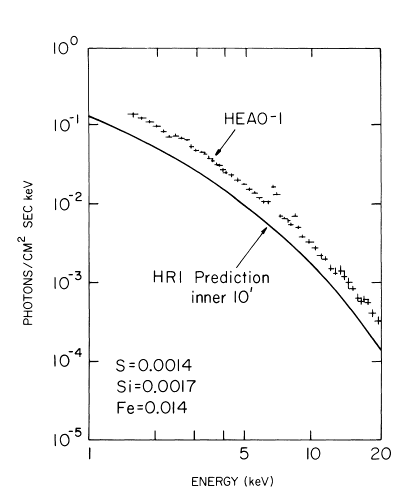
The central galaxy in the cluster is a well studied source of X-rays, and the Perseus is one of the brightest cluster X-ray sources. The spectrum from the HEAO-I (X-ray) mission is shown in figure 3.8.
A more detailed optical image from the Jacobus Kapteyn Telescope of the central galaxy is shown in figure 3.9. There is lots of filamentary structure around the galaxy, and signs of a galaxy falling in (upper right).
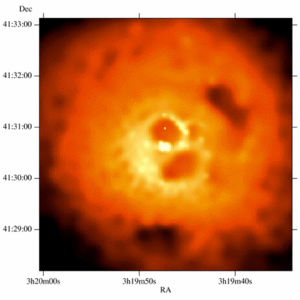
The central galaxy has also been observed in the radio and the X-ray region, in stunning new detail by the Chandra X-ray observatory (figure 3.10). These images show complicated structure in the core: firstly there is a central bright X-ray source, probably due to an accretion disk around a black hole. There is a shadow in the X-ray image at the location of the small galaxy suspected from the optical image to be falling into the central galaxy. If so, its fate is to eventually provide yet more fuel for the central black hole.
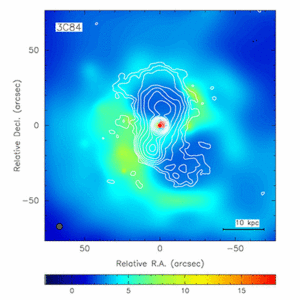
There are two large bubbles around the black hole. These might be lower density (magnetised) regions produced by emission from the central regions. They correlate quite well with the radio emission in the Very Large radio Array (VLA) image (figure 3.11).
The X-ray gas in the cluster is very hot, so the cluster must contain enough mass to keep the gas from evaporating into the surrounding space. Calculations show that the gas and stars together in the cluster are not enough to hold the hot gas in place, and the interpretation is that there is a a great deal more matter in the cluster than is visible - the so called dark matter. Many other clusters show a similiar problem, and it seems that a significant fraction of the Universe is in some dark form which has yet to be observed directly.
Further information :
chandra.harvard.edu/press/00_releases/press_060700pers.html
A cloud of ionised gas emits bremsstrahlung radiation due to the interaction of the electrons and protons. Since energy is being lost, the cloud is cooling. Let's look at an example of this.
Suppose we take the matter in our own Galaxy, and heat it to 106 K in a spherical region of order the Sun's distance from the Galactic center, R » 10 kpc.
Consider the cloud to be fully ionised Hydrogen and uniform in density, with a total mass of M = 1011 MO.
The total number of protons, Np and electrons Ne is
| (6) |
| (7) |
The volume of the cloud, V, is
| (8) |
and so the electron number density is
| (9) |
In an ionised medium, the primary source of opacity is due to Thomson scattering, i.e. photons being scattered by free electrons. In a uniform medium of electrons with density ne, the optical depth l, of the cloud is
| (10) |
where sT = 0.67 ×10⁻²⁴ is called the Thomson cross-section.
We need to know if our cloud example above is in the optically thin or optically thick regimes, i.e. we ask, does the average photon escape from the cloud with minimal interaction with the electrons or not?
Adopting ne = 1 cm-3, and noting that 1 pc =3 ×1018 cm, we have for l,
| (11) |
The optical depth (500 kpc) is much greater than the physical dimensions of the cloud (10 kpc) and can conclude the cloud is optically thin - in other words, the electron density is so low that the radiation can escape easily.
|
Problem 3.1 What electron density is required to make the cloud optically thick?
|
We have started with a cloud at a temperature of 106 K, which means the thermal bremsstrahlung radiation cutoff will be near a frequency n,
| (12) |
so that n is in the UV region,
| (13) |
Such a cloud would be a source of UV photons.
|
Problem 3.2 The mean density of free electrons in the Universe is about 10-5 cm-3. Show the Universe is optically thin to electron scattering. UV photons from a distant cloud like the one above would nevertheless be very hard to see. Why?
|
The cloud consists of free electrons and protons in motion at uniform temperature, and so is emitting thermal bremsstrahlung radiation. Let's work out how much.
In cgs units the power emitted per cubic cm is
| (14) |
Here, gB is the frequency averaged gaunt factor for the thermal distribution of velocities, and is of order unity (it is usual to adopt gB = 1.2; ne is the electron density, ni is the ion density, and Z is the charge on the ion. Since the cloud is made of ionised Hydrogen, the ion is a proton, and Z = 1.
The radiated power per cubic cm is
| (15) |
| (16) |
From the volume of the cloud, V » 1068 cm3, we compute the total radiation loss, [ dE/dt]
| (17) |
The electrons in the cloud are producing the bremsstrahlung radiation, so they must be losing energy, and will slow down. The kinetic energy of each electron is just [ 3/2] kT, where the temperature of the cloud was T = 106 K.
The KE per electron is
| (18) |
There are » 1.2 ×1068 electrons, so the total KE of the electrons is
| (19) |
Now we know how much energy is in the cloud and how much energy is being lost, so we can estimate how long the cloud will take to cool down.
| (20) |
which comes out to be of order 106 years. Hot thin plasma clouds can cool quite rapidly!
|
Problem 3.3 Derive a general expression for the cooling time t for a thin plasma, via thermal bremsstrahlung, in terms of the electron density ne, ion density ni, ion charge Z, radius R, and temperature, T.
|
Let's return to our case object, the Perseus cluster of galaxies, which shows a Bremsstrahlung spectrum in the X-ray region. The cooling time for this system, after one has accounted for the range of densities and temperature from the inner to the outer parts of the cloud, turn out to be relatively short compared to the age of the Universe. Computations indicate that hundreds of solar masses per year of gas is being deposited into the core of the system (Fabian et al 1981).
|
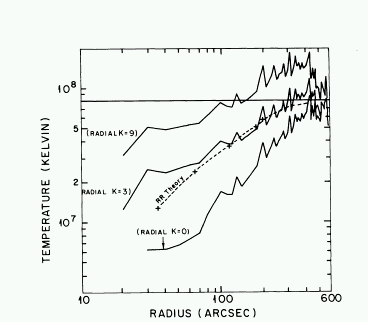
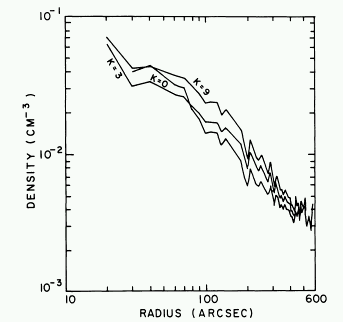
Problem 3.4 Models of the temperature and density profile of the Perseus X-ray emitting regions are shown in figure 3.12 and 3.13. Make a rough estimate of the temperature and density in the cloud from these plots in the inner and outer regions, and compute a cooling time for each place. How uncertain are your estimates, based on uncertainties in getting values from the plots?
|
What is happening to this cooling gas? One old idea is that it is turning into stars, which populate the central galaxy - in other words, the galaxy is growing from the cool, infalling gas. A long search for this gas has proven inconclusive however; the inner regions of these galaxies turn out to still quite warm (order 1 keV).
Recently, a new idea has emerged which looks quite promising - the gas is being processed by the central regions of the galaxy, being reheated and sent back outwards again in giant hot bubbles! Figure 3.11 shows two of these bubbles. The are corellated with the positions of the radio lobes, thought to arise from the jets produced by a central black hole. Not everything yet makes sense with this explanation, but there are many things about it which can be tested. The idea also allows us to see a firm link between the central engines of galaxies, and their gas and stellar content, something which has not been generally thought important until now.