The BATSE the (Burst and Transient Source Experiment) was a very succesful NASA high energy experiment aboard the Compton Gamma-Ray Observatory mission, launched in 1991 and running for 9 years. In this lecture we are going to follow a particular source of X-rays picked up by the satellite in one of its sky surveys.
The source we'll study is ``GRO-J1655-40'', discovered as a bright burst of X-rays seen by BATSE on July 27th, 1994. For a while it was the brightest X-ray source on the sky. The source's name includes its approximate position on the sky, at a = 16h 55m and d = -40°.
X-rays are known to come from supernova remnants, pulsars, active galaxies, quasars, massive galaxies, galaxy clusters, neutron stars and black holes. We want to decide between these or other possibilities.
First fact: the source is at a = 16h 55m and d = -40°. This is directly in the Galactic plane, and has Galactic coordinates (l,b) = (345°, 5°). Figure 4.1 shows the high energy gamma ray map in Galactic coordinates from the EGRET instrument on the mission. The Galactic plane is a major source of gamma radiation. Individual sources of gamma rays, whith some identifications, have been shown in figure 4.2. The situation is much less clear for X-rays (figure 4.5); in this region, the Galactic plane is indistinct and the sources of radiation are dominated by bright point like sources.
GRO-J1655-40 is right in the Galactic plane, which strongly suggests that the source is in the Milky Way. This suggests a neutron star, supernova remnant (SNR) or black hole candidates.
The satellite continues to check back on the source every few days (see figure 4.4); meanwhile, radio maps are obtained of the region on the sky around the source, at the Very Large Array (in New Mexico) at 1.49 GHz and at Molonglo in Australia at 0.843 GHz. In the meantime, attempts are underway to find the source in the optical. The UK-Schmidt all sky survey is the appropriate one to use, because the GRO-J1655-40 is well into the southern hemisphere; this survey consists of several thousand 30 ×30 cm glass plate images of the sky, to about visual magnitude 20, covering about 5 ×5 degrees each. The accuracy of the coordinates are not good, due to the low resolution of the X-ray instrument of about 0.3 degrees. At CITO (Cerro Tololo Inter-American Obervatory), the 0.9 meter telescope is used to obtain 15 CCD images of a region 0.6×0.6 degrees around the source. If the source turns out to be unresolved in the optical (i.e. it is not an extended source, like a galaxy), then it will only be about 1 arcsecond in size and quite difficult to identify amongst many thousands of similar looking objects on the images. Monitoring the field over several nights is the key, because it is likely to be highly variable.
August 10th, 1994: one particular object is identified in the field - it varies by up to half a magnitude irregularly. We now have a possible source in the optical, at a = 16 54 00, d = -39 50 45 (2000). It's in the middle of figure , which is 15 minutes on each side.

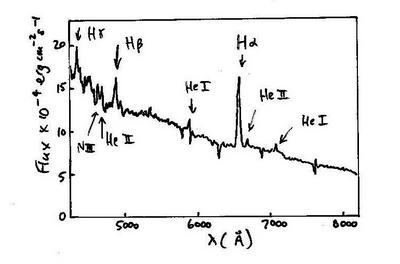
Having gotten a target object, a spectrum can be obtained. Figure shows a spectrum in the optical, obtained August 12th 1994 at the 1.5 meter telescope at the European Southern Observatory at La Silla in Chile. The spectrum shows a variety of emission lines on a blue continuum, lines due mainly to hydrogen and Helium. The spectrum is typical of so-called X-ray novae in outburst. The source appears to be a new X-ray binary star, consisting of a neutron star (or black hole), girthed by an accretion disk, and accompanied by a low mass, main sequence star.
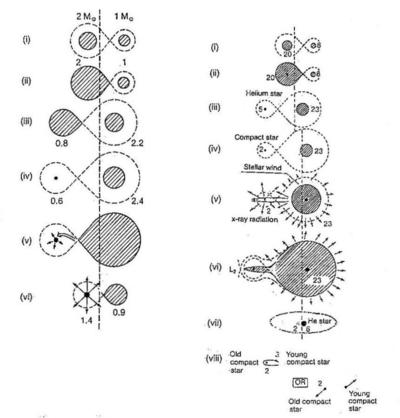
X-ray binaries are formed from normal binary stars, one of which has left the main sequence. Two main pathways exist, as illustrated in figure 4.7.
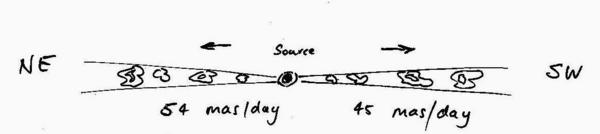
In the radio region, a study is undertaken at the VLA, monitoring the sytsem regularly during August and September 1994. First observations show an unresolved source, less than 100 milliarcsec (mas) in angular size. Six days later, the radio flux peaks and the source is now about 200 mas, extending roughly East-West. After this, a ``jet'' and series of ``blobs'' appear. Optical identification of the secondary star (see below) indicates that the system is about 4 kpc away. The speed of these blobs away from the central source can then be computed and turns out to be super-luminal (apparently faster than the speed of light), indicating that one of the jets is pointed toward us as observers. Apparently superluminal motion can result in this case, even if the motion is actually subluminal. The blobs appear on time scales of a few days (figures 4.8, 4.9).
Radio observations at 5 different wavelengths (1.49, 4.9, 8.4, 14.9 and 22.5 GHz) show a power-law spectrum with an index of a » -0.6. This is a classical indicator of synchrotron emission, implying relativistic electrons moving in a magnetic field.
The system was monitored in various bands for months afterwards - in the optical it eventually dropped enormously in brightness (Feb-Mar 1996), and became relatively constant in magnitude, a phase referred to as quiescence, meaning 'quietness'. This is an opportunity to study the system without the complications of high energy and other emissions due to the accretion disk and possible jets (as we'll see later).
A study in the optical is undertaken with the 1.5 meter and 4.0 meter telescopes at CTIO in Chile, which identifies the MS companion to the compact object as a F type giant star, and its orbital motion is measured in detail (figure 4.10). The amplitude of the radial velocity is large, and the period is rather small (2.62 days).
The radial velocity can be quite well fit with a sin curve, with an amplitude of 456 km/s and a period of 2.62 days. The visible star of the system, the F subgiant, has a mass of about 2.3 MO, meaning that the mass of the compact object can be computed as about 7.0 MO. As far as we know, no object can be this massive and still in stellar form (the limit is about 1.4 MO for neutron stars and white dwarfs); the conclusion is that this is a black hole. Its high mass, and the very detailed observations possible with this system make it one of the best black hole candidates.
The optical light curve is very regular, showing two dips of unequal depth - the classic signature of some sort of eclipsing system (figure 4.11). Armed with these data, Orosz and Bailyn (1996) have constructed a model for the system, illustrated by figure 4.12.
| Parameter | symbol | value |
| inclination to line-of-sight | i | » 70° |
| primary mass | M1 | » 7 MO |
| secondary mass | M2 | » 2.3 MO |
| mass ratio ass | Q | » 3 |
| accretion disk radius | rd | » 0.75* |
| temperature, disk rim | Tdisk | » 4400 K |
| flare angle of disk | b | » 2.2° |
| temperature of secondary | Teff | » 6500 K |
| power law exponent of disk | x | » -0.2 |
The model consists of a central black hole, with a mass of 7.0 ±0.2M|odot, around which is a fairly thin accretion disk and a subgiant secondary (F IV) star (2.3 MO). The rotation axis of the system is tilted by about 30 degrees to the line-of-sight. Emiision from the system in the optical is primarily due to black-body radiation from the secondary (Teff » 6500 K) and the accretion disk, which has a temperature at the outer rim of about 4400 K, increasing inward to temperatures at which X-rays are being produced (several keV). Full details of the best fitting parameters of the model are shown in figure 4.13.
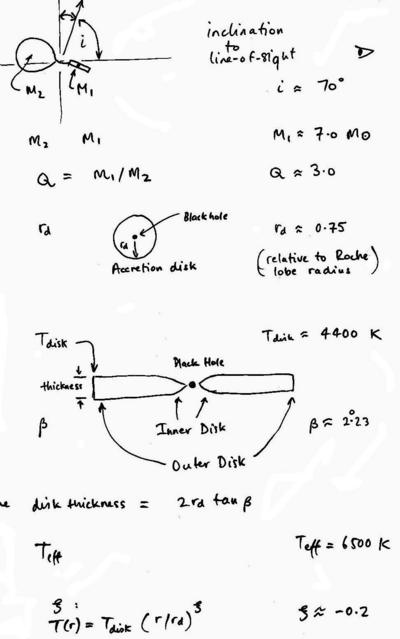
Figure 4.12 is shown to scale - i.e. the star and accretion disk are in close proximity and of similar physical size. Once per orbit, the star partially eclipses the disk, and vice-versa. Only a small part of either body is eclipsed, so that the dips light curves are relatively small. It is the cool rim of the disk which is being eclipsed by a hotter star, so that the light curves are quite colour dependent (figure 4.11) - note how well the model fits the data well in all of the observed colour bands B, V, R and I. The model is a very good fit to these data.
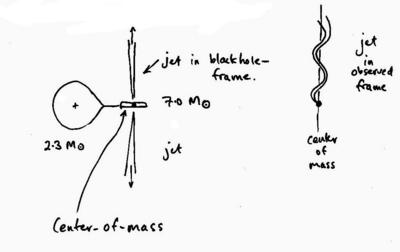
What about those blobby radio jets? The blobs were appearing and then moving away from the central source every few days - quite similar to the orbital period of the system (2.26 days). Could these be related? Figure 4.14 shows that, since the black hole mass and companion mass are not so different, the centre-of-mass of the system is offset a little from the black hole (which is presumably at the jet base). This is a simple way to produce a corellation with the system period, but at present the evidence to support this idea is weak.
Systems like GRO 1655-40 have become known as microquasars - and very useful probes for the study of quasars, which also are thought to contain a central compact object, accretion disk and jets. The much lower mass of the central object (few MO, compared to 104-1010 MO for quasars) lends the very great advantage that these sources operate on much shorter timescales than quasars proper. One can follow their goings-on much more easily!