In planetary studies, with radio wavelengths in the mm - cm region, one typically probe regions in planetary atmospheres, magnetospheres and regions near planetary surfaces. At cm wavelengths, for example, one probes well below the visible cloud layers (in the gaseous giants) or about 10 wavelengths deep into the surface layers of the rocky planets.
Solar system planets come in two main classes - rocky and gaseous, or ``terrestrial'' (Earth, Mars, Venus, Pluto, Mercury)and ``giant'' (Jupiter, Neptune, Uranus, Saturn). Extrasolar planets, presently (2005) numbering in the hundreds, almost all fall into the giant class, at least in terms of their masses.
There are large variations within these groupings, however. Models of the interior structure show large differences between Saturn/Jupiter and Uranus/Neptune. Saturn, Jupiter and Neptune still contain substantial heat. Saturn and Jupiter both emit about twice as much energy as the receive from the Sun, while Uranus emits a little more (13%) than it receives. This radiation is substantially blackbody.
At cm wavelengths, an additional component to the thermal emission appears, due to synchrotron emission from relativistic electrons gyrating in the planetary magnetic field.
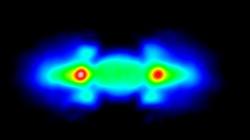
Radio synchrotron was first detected in 1955 (Burke and Franklin) at 22.2 MHz (13.5 meters), providing the first evidence that Jupiter has a magnetic field. Microwave emission was first seen at 3 cm in 1956 by Mayer etal (1958). The brightness temperature indicated by thes measurements is about 140 K, much cooler than the blackbody temperature of these planets, then expected to be a few 1000 degrees K. The next step was to use interferometry, to get a better resolution map, to show that the emission was not coming from the disk of the planet, but from a region about 3 times larger than the Jovian diameter (Roberts, 1960). The emission was mainly in the East-West, rather than the North-South directions, and about 30% linearly polarised (quite a lot!). This was enough to imply synchrotron as the emission mechanism.
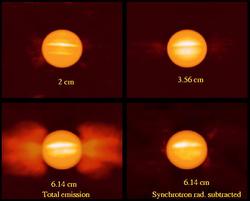
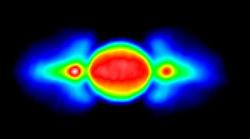
Maps at cm wavelengths are show in figure 4.1. The synchrotron emitting lobes wither side (actually encircling) the planet are very clear at 6 cm; at wavelengths around 2 cm they are practically gone. At 6 cm the lobes are quite distinct from the planet's disk; at 20 cm the system looks more like a belt, joining with significant emission from the planet itself.
From lecture 4, we know that the synchrotron emission peaks at around 0.29nc. In units of MHz, this is
| (1) |
where the electron energy E, is in MeV, and B is in Gauss.
The peak emission is seen at about 20 cm, and the magnetic field strength is estimated at about 0.5 G, implying that the electrons have energies of some 25 MeV. Magnetic field strength measurements were first made in situ by Pioneer 10 and 11 in the 1970s. The Pioneers also measured the tilt of 11 degrees.
As one moves to other wavelengths, the corresponding electron energy changes; in other words, one probes different parts of the electron population by changing observing wavelength. Furthermore, the magnetic field strength decreases with distance from the planet, so that one is also probing different electrons as a function of distance.
Where do the energetic electrons come from? The answer lies (at least partly) at the center of the Solar System, in the ``solar wind''. The solar wind expells from the Sun about 109 kg/sec, with velocities of a few hundreds km/s up to 1000 km/s. There are also local sources of electrons at Jupiter itself, from some of its satellites!
|
Problem 4.1 Assume that the electron density in the synchrotron clouds around Jupiter is about 1 cm-3 and the magnetic field strength is about 0.5 Gauss. Make an order of magnitude estimate of
How does your order of magnitude estimate compare with the energy ouput indicated in figure 4.4? Note: 1 Jansky (Jy) is 10-26 W m-2 Hz-1, where 1 Watt is 107 erg/sec.
|
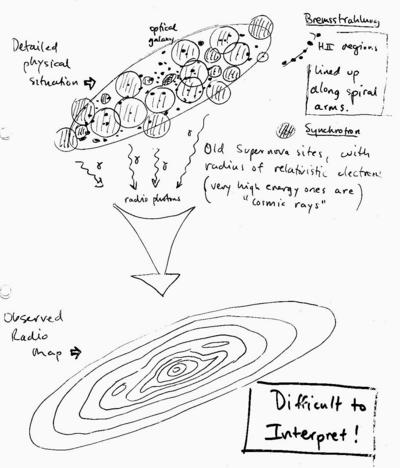
Most of the gas in the Galactic disk is in an unionised, or neutral state, and is termed H I. Under the right conditions, such as near a hot star or after a supernova explosion, the gas can become ionised, and these places are called H II regions. The gas in both states is more generally called the interstellar medium or ISM.
H II regions are hot ( ~ 104 K) and sit in a background of ``cold'' ( ~ 102 K) H I. H II regions stand out very clearly on direct photographs (or CCD images) of external galaxies. This is because they are dominated by emission lines of various species, such as hydrogen itself, but also helium, oxygen, carbon, calcium, silicon, iron etc. Images taken in the light of Ha at l = 6563 Å (i.e. the a-line of the Balmer series) show H II regions dramatically, because much of the light in the visible region is emitted in this line. As a consequence H II regions typically appear pinkish on colour images.
H II regions are typical in spiral galaxies, in particular in the spiral arms, where young stars provide copious ultra-violet photons which are needed to ionise the gas. The most prominent are star forming regions, in which there are plenty of freshly born, hot stars. Some of these regions can contain so many energetic stars that they can ionise a significant fraction of the gas in a galaxy.
Star forming regions are prominantly associated with spiral arms in disk galaxies, and because of their clear emission lines, are an excellent way to trace the kinematics and rotational properties of the galaxies.
Elliptical and S0 galaxies rarely show prominant H II regions. These galaxies are mostly old, and have usually already used up most of their gas. They do show planetary nebulae however, and although they are rather faint, they are an important distance indicator.
H II regions have a certain size around an ionising source which is a balance between the flux of ionising photons on one hand, and the rate at which the plasma can cool and the ionised electrons can re-combine with the protons. If the ionisation rate is greater than the recombination rate, then the plasma will become almost fully ionised. Studies indicate that less than a per cent of the hydrogen remains unionised in typical regions.
Ultra-violet photons below a wavelength of l = 912 Å, have sufficient energy to ionise hydrogen, removing the electron from the ground shell. The electron is eventually recaptured, but because interstellar gas is of such low density, this can take some time.
Hot stars are the best sources of the UV photons needed to ionise the gas. In practice this means very early type stars, such as O and B stars, and white dwarfs. The surfaces of the O and B stars range in temperature from 10,000 to 60,000 K, while white dwarfs can reach surface temperature of up to 200,000 K.
Recombination leads to emission lines, as shown in figure 4.7. Important ones are Ha at 6563 Å, [N II] at 6583 Å, [O II] at 3726 and 3729 Å and [O III] at 4959 and 5007 Å.
A special notation has been used here, the square brackets, ``[ ]''. This indicates that the line is normally ``forbidden'', meaning it is only seen in very low density conditions. In the laboratory, plasmas are generally of such high density that these line are not seen. The lines originate from energy states just above the ground state, and are meta-stable with long lifetime.
The emission lines form very useful diagnostics of the physical conditions in the the gas. For example, the [O III] and [N III] lines are temperature sensitive, while [O II] and [S II] (at 6716 and 6731 Å) are more sensitive to the electron density. This is because the latter lines are emitted at different levels but with nearly the same excitation energy, so that theie relative ratio is a diagnostic of the collisional de-excitation, or the density, of the gas. The plasmas are found to be very thin by terrestrial standards, with particle densities of order 10 to 106 cm-3.
Observations at radio wavelengths are very interesting, because these regions typically emit bremsstrahlung radiation at these frequencies, giving an excellent independent probe of the temperatures and electron densities in the clouds.
Measurements of the line strengths also give information about the ratios of elemental abundances, so that the composition of the ISM can be studied.
The shapes of the lines also give information about the kinematic conditions in the nebula, since they are sensitive to the velocity of the ions, either through thermal broadening or bulk motions.
A higher resolution spectrum of H II regions in a spiral galaxy is shown in figure 4.9. The H II regions on either side of the center are redshifted and blueshifted relative to the center of the galaxy.
Complexes of young stars emerging from freshly collapsed gas characterise star forming regions. A magnificent example is the Orion nebula, which is visible as a fuzzy patch to the naked eye. Figure 4.10 shows the central region of this nebula, a region which in the optical is almost deviod of stars, but which when observed in the infra-red, has recently been shown to contain many sources behind a shielding screen of dust. Dust is very common in star forming regions.
Fresh stars are born with a range of masses, with low mass stars ( ~ 0.5 MO) dominating. The small number of very massive stars (M > MO) have a great effect on the development of the region, since they provide the bulk of the ionising UV photons, and can heat the surrounding gas to a few ×104 K. Just a few massive stars can clear an impressive region around themselves, exposing the rest of the newly formed, and suppressing further star formation. The massive stars are also short-lived, burning through their fuel at a fierce rate and eventually ending their lives as supernovae, which injects enormous amounts of energy into the surrounding gas and heating it to much greater temperatures (106) K.
Star forming regions range in size from order 10-3 pc to several 100 pc. Particle density ranges from > 106 cm-3 in the compact regions down to 10 cm-3 in a giant H II clouds. Three spiral galaxies are shown in Fig 9.1 in broadband light and the light of Ha, showing how closely spiral arms and other kinematical features in the disk are associated with star forming regions.
Planetary nebulae (PN) are small regions of ionised gas around a very hot central white dwarf, and are formed during the final stages of stellar evolution. They have a very wide range of shapes and properties, as can be seem from the splendid Space Telescope images in figure 4.11. This type of nebula was discovered by Herschell in 1785, who referred to them as ``planetary'' because they appear disk-like in telescopes (like planets). About 2000 PN are known in the galaxy, and they are also rather easily recognised in the closer external galaxies.
Temperatures, densities and compositions for PN can be derived fairly easily. The central star can always be seen, and its temperature measured, allowing the amount of UV flux it produces to be estimated. This UV flux then heats the nebula, and various emission lines used to derive electron densities and temperatures, and finally the abundances of the elements.
Most PN have abundances like stars in the Galactic disk, as expected if they have evolved from disk stars. PN of the Galactic halo are much more metal poor, also as one would expect. There can be interesting differences however. Helium, carbon and oxygen can be strongly enhanced relative to PN parent stars; this is because these elements, which are created in the parent population during nuclear burning, but which are hidden below the surface, can get mixed into the outer layers of the star when it is on the giant branch and be expelled into the surrounding gas, which is later lit up by the central star when it becomes a white dwarf.
Ionised masses in PN are typically a few tenths of a solar mass. Lots more images can be found at http://www.noao.edu/image_gallery/planetary_nebulae.html
The name given to an ionised region is Str�mgren Sphere, after the Danish astronomer Bengt Str�mgren. Ionising photons moving outward from a central source can ionise a finite region around it, set by the ionisation rate and recombination rate. For a UV flux S*, the radius R of the region is given by
| (2) |
where np is the number density of protons in the gas surrounding the source, and b ~ 2.6 ×10⁻¹³ cm3 s-1 is the Hydrogen recombination coefficient. There is a thin layer around the ionised region, called an ionisation front, which forms the transition zone from hot ionised gas to the cold surrounding gas. The thickness of this zone is approximately equal to the mean free path of photons in the front.
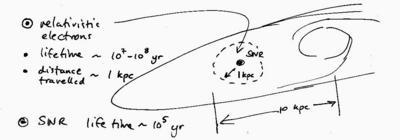
Supernova remnants (SNR) are often synchrotron sources. The explosion of the supernova (SN) leaves a small, hot, highly magnetic plasma cloud, expanding outwards at several 1000 km/s. A neutron star or black hole remnant is typically left behind, and the cloud eventually merges and dissolves into the interstellar medium (ISM), i.e. the gas and dust in the surrounding galaxy. A typical galaxy, like the Milky Way, yields a few SN/century, and the SNR are distinct objects for about 105years. About 100 SNR are catalogued in the Milky Way (there are very many more than this, but they are difficult to pick out in the Galactic plane, where they mainly occur).
Superficially, SNR appear like HII regions, but observations in the radio are very different between the two, as seen in figure 4.12.
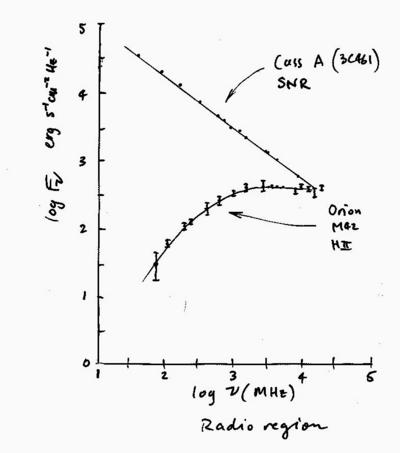
We already looked at the Crab nebula in a previous lecture; in this case the source of relativistic electrons for the synchrotron emission is likely to be the pulsar itself. Cass A is only about 300 years old, and is similar to the Crab in this respect. The expanding gas is moving at about 10,000 km/s, and is quite shell-like in the optical. It will probably expand to a size of 50 or 100 pc before dissolving into the ISM.
| Parameter | Crab | Cass A |
| explosion | 1054 AD | 1681�15 AD |
| progenitor mass | 9 MO | � 15 MO |
| ejected mass | 2-3 MO | 4 MO? |
| angular size | 4.5×7 arcmin | 6.5 arcmin |
| physical size | 3×4 pc | 5 pc |
| distance | 2 kpc | 2.8 kpc |
| expansion rate | 1450 km/s | 104 km/s |
| radio flux density | 1040 Jy at 1 GHz | 2700 Jy at 1 GHz |
| spectral index | a = -0.30 | a = -0.856 |
| total luminosity | 1038 erg/sec |
|
Problem 4.2 Cass A has been studied in detail uisng the Chandra X-ray observatory. The plasma temperature is about 50 million K, as evidenced by emission lines from highly ionised elements (figure 4.14. Suppose that the SNR consists of a few solar masses of ejecta, and using data from the table, estimate
Assume you can extend the radio spectrum (figure 4.12) to the X-ray region. How does the X-ray luminosity due to this extrapolation of the synchrotron component compare to the bremsstrahlung estimate above?
|
``Normal'' galaxies are those that do not harbour active supermassive black holes or other nuclear monsters; most nearby galaxies are in this class, despite the fact that recent observations have shown that most nearby galaxies have black holes in their cores. For normal galaxies, the dominant emission mechanisms are thermal, and synchrotron or bremsstrahlung.
Nearly all radio emission from normal galaxies comes from specific synchrotron sources, and bremsstrahlung from HII regions.
Thermal re-radiation of starlight by dust typically dominates these components above about 200 GHz (1.5 mm). The other source of emission near this wavelength is the microwave background. Radio emission is nevertheless a very minor fraction of the overall luminosity of galaxies, typically less than one part in 104, but has plenty to say about local conditions.
Stars more massive than about 8 MO produce type II and type Ib supernova remnants. These are typically short lived (lifetimes < 3 ×10⁷ years, and the relativistic electrons produced have lifetimes of order 108 years. These are typical sources of synchrotron emission, and in this sense radio maps probe where and how much star formation has been recently occuring in a galaxy, over the last few hundred million years.
Figure shows three components making up the radio-IR for M82 (after Condon, with data from Klein etal 1998, Carlstrom and Kronberg 1991). M82 is an irregular galaxy which appears to be undergoing a mild ``starburst''; there are many more SNR, HII ans star formation regions than in more regular galaxies. This may be due to a dynamical encounter with its near neighbour, M81.
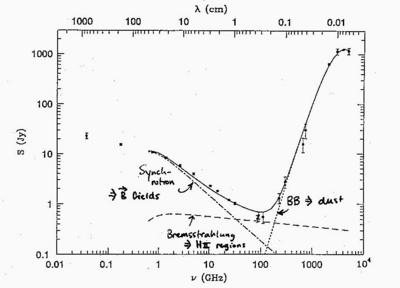
In radio and the far infrared (FIR) bursts of star formation are optically thin: the flux in these regions is a good indicator of star formation rate. Bremsstrahlung from such regions can sometimes be competitive with synchrotron, and sorting the two out isn't easy. Most easily recognised is synchrotron at about 1 GHz, which arises from (old) relativistic electrons which have moved a long way from the supernova remnants (SNR) in which they were created. The SNR themselves may have long since merged with the interstellar medium (ISM) and are no longer visible.