|
| ||||||||||||||
|
|
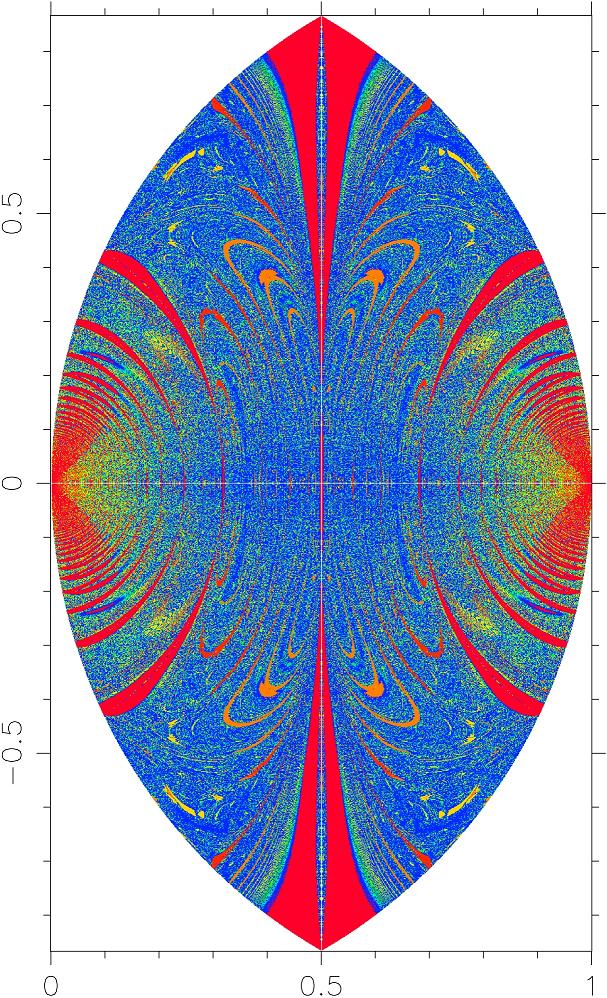
What happens when three stars of equal mass are placed at rest at three points in space and allowed to fall toward each other under the infuence of gravity alone? This is the question addressed in a new study by astronomer Harry Lehto at Tuorla Observatory, in collaboration with Samuli Kotiranta, Mauri Valtonen, Pekka Heinämäki, Seppo Mikkola at Tuorla Observatory and Arthur Chernin at the University of Moscow. The three stars are placed at the corners of a triangle, the sides of which are generally unequal. They are initially at rest, and gravity soon pulls them toward each other. A rich array of outcomes is possible. Two of the stars might form a hierarchical system, circling each other, with the third body circling the inner two. Generally speaking, long term stable configurations such as this are rather rare. Much more typically, the system breaks up, with one of the stars being ejected with sufficient energy never to return.
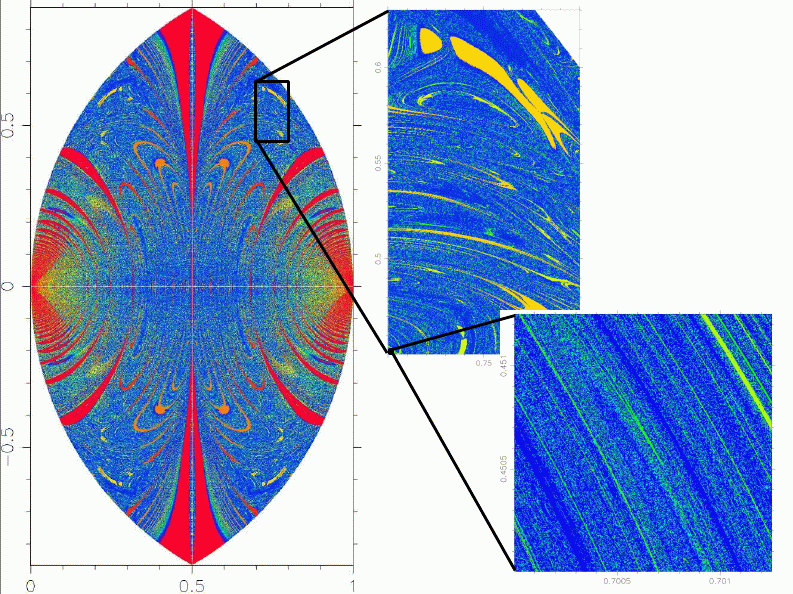
It has been known for over a century that such a system can be extremely sensitive to the starting positions of the stars. Investigating the rich array of possible outcomes was the aim of the study, which made use of high performance computers. The result is the beautiful "Massai Shield" shown in the figure. The plot shows the outcome of the interactions depending on how the stars were initially arranged. Any point in the diagram completely represents the triangular configuration of the three stars at the beginning. The first star is always placed at position (0,0), the second at position (1,0) and the third at a position relative to these two. As concrete example: the point x=0.7, y=0.5 from the figure represents the behaviour of a system of three equal mass stars, one placed in the center of the figure, one placed at the far right in the figure, and the third at the point (0.7, 0.5). Using highly accurate computer calculations, the orbits of each star under the gravity of the other two is followed, usually until the system breaks up. Redder colours are systems in which the system broke up quickly, with one of the stars being ejected in a short time. Bluer colours denote systems which take longer to break up, while the deepest blue denotes systems in which the stars remained together until the end of the simulation. The map shows where systems are stable and where they are not. There is a great deal of structure. A system close to an isosceles triangle (in which two of the sides are equal in length) is typically very unstable (the vertical red band in the center of the map). The roughly concentric circles of red to the left and right of the map are also unstable - these are systems in which the stars soon all approach each other very closely, leading to one of the stars being ejected. Systems which break up not with the first approach of the stars to each other, but with the second such approach, show up as families of orange bands in the middle of the map. Our demonstration point at (0.7, 0.5) is in an area of tranquility, where most of the systems are able to survive for a long time (blue regions).
Zooming in on any region reveals tremendous new structure. The second figure shows one such zoom, near the region (0.75, 0.55), followed by another zoom at the point (0.7005, 0.4505). The systems revealed show highly complex structure, with many islands of instability (yellow) surrounded by stable regions (blue). Zooming in still further reveals stirated structures of very long term stability (deep blue) amongst short and medium term unstable systems (yellow and green). The study of triple systems has been published in the Monthly Notices of the Royal Astronomical Society, and is available as a preprint. For more information please contact Harry Lehto. All images copyright Harry Lehto, 2008. |