The European Space Agency's Hipparcos satellite was launched in 1989 and spent 5 years scanning the sky and measuring parallaxes and proper motions for circa 120,000 stars. About half of these stars were choosen from existing catalogs brighter than a certain magnitude (about 7.5) as a function of galactic latitude b on the sky.
The other half of the stars were simply "interesting" stars for which the measurement of distance or proper motion was proposed by Astronomers around the world.
The first half of the catalog provides a complete snapshot of the distribution in space and kinematic state of stars near the Sun. The measurement accuracy of parallaxes was about 1 milliarcsec (1 mas =0.001 arcsec). A star 1 kpc distant from the Sun has a parallax of 1mas, so that for such stars the parallax error is 100% of the parallax. For stars 100 pc away, the parallax error is 10% of the parallax, and this approximately sets the useful limit to which distances can be reliably measured.
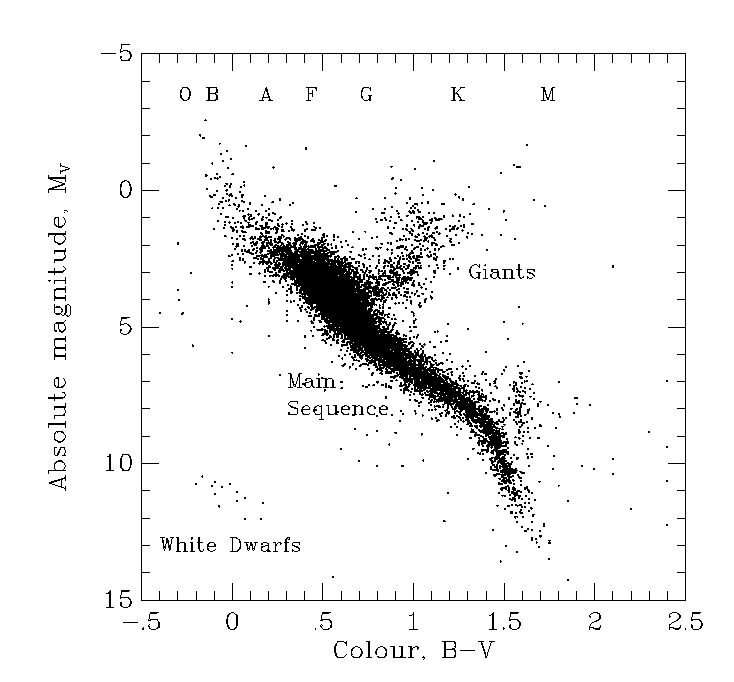
Recall that the Colour-Magnitude Diagram (CMD) for Hipparcos with good distances (smaller than 15% errror) looks like this :

For each star, the position on the sky (right ascension and declination),
the proper motion, parallax and magnitude were measured.
The distance D in pc comes from the parallax (measured in arcseconds)
D = 1/parallax.
Note that the parallax is usually denoted by π.
D = 1/π.
The position on the sky can be converted from celestial coordinates (right ascension, α and declination, δ to galactic coordinates (l,b) via a spherical trigonometric transformation.
|
Galactic system of coordinates An astronomical coordinate system using latitude measured north and south from the galactic equator and longitude measured in the sense of increasing right ascension from 0 to 360 degrees. Galactic latitude is designated "l", galactic longitude "b". The reference points for galactic coordinates were changed by action of the International Astronomical Union in 1958. The new values are: the north galactic pole lies in the direction right ascension = 12 hours 49 minutes, declination = 27.4 degrees N (equinox 1950); the new zero of longitude is the great semicircle originating at the new north galactic pole at the position angle 0 = 123 degrees with respect to the equatorial pole for 1950. Source: http://sulu.lerc.nasa.gov/dictionary/ |
The distance and position on the sky can be converted to the cartesian system of Galactic coordinates (X,Y,Z) and, if the radial velocity is known to the Galactic velocities (U,V,W). Note that in order to recover the 6-D position vector and velocity vector of a star in space one requires 6 measurements, distance, two coordinates on the sky, two apparent motions on the sky, and the radial velocity.
X = Rsun − D cos(b)cos(l)
Y = D cos(b)sin(l)
Z = D sin(b)
U = VR cos(l)cos(b) − Vlsin(l) − Vbcos(l)sin(b)
V = VR sin(l)cos(b)+Vlcos(l) − Vbsin(l)sin(b)
W = VR sin(b)+Vbcos(b)
where Vl is the velocity of the star along the direction of increasing Galactic latitude and Vb is the velocity along the direction of increasing Galactic longitude.
The transverse velocity of a star (in km/s) is related to the proper motion μ (in arcsec / year) and the distance D (in pc) as
V = 4.74μD
| Exercise #1: prove the formula above for the transverse velocity of a star (i.e. its motion perpendicular to the line of sight). |
Hipparcos found about 8000 stars within 80 pc. We shall now examine this
sample in detail.
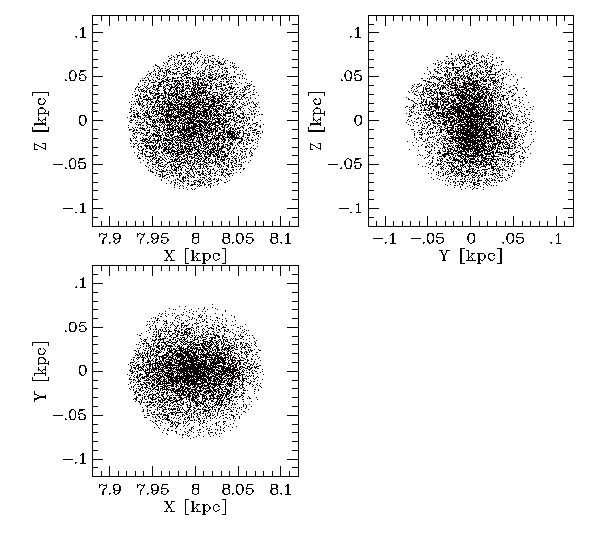
The central parts of these plots are dominated by intrinsically dim stars, which are too faint to be seen in the outer regions (ie. all the way out to 80 pc). To see this, the next plot shows the stars have divided by spectral type and plotted in the (X,Z) plane.
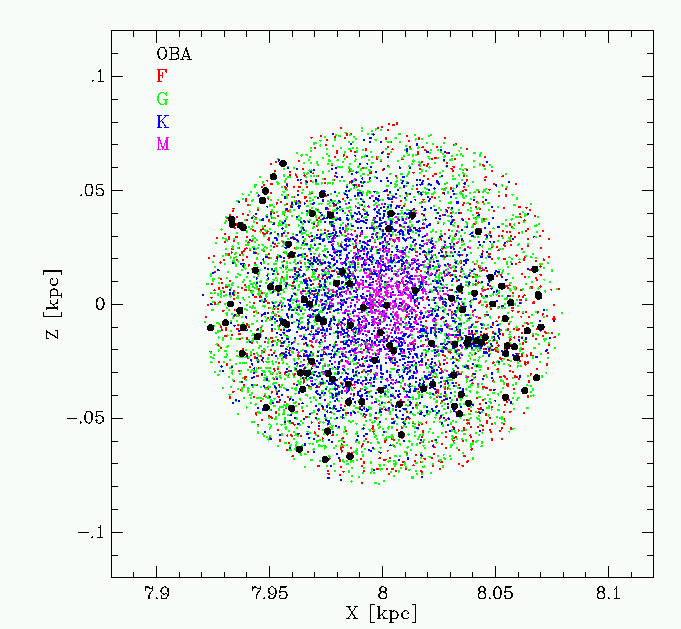
What you see here is that the faintest stars, the M dwarfs, are restricted to the inner 20 pc or so, while progressively brighter stars are seen fill progressively larger spheres. The sample is complete out to 80 pc for F stars and earlier. There are only a handful of the earliest types in the sphere (O, B and A) stars. These have been shown in black, and there is an indication already that they are more restricted to the plane than the other types.
For any given star with a parallax measurement, we can determine its (X, Y, Z) position in space, and from proper motion and radial velocity measurements, we can determine its (U, V, W) velocities. Plots of the U, V, W distribution for nearby stars shows many features, as we have seen in module 2. Specifically, older nearby stars tend to have more random velocities than younger stars, although for all disk stars, the motion is dominated by their high orbital speeds around the center of the Galaxy.
The motion of the Sun itself can be determined relative to nearby stars from radial velocity, distance and proper motion data. This has now been measured very accurately using data from the European Space Agency's Hipparcos satellite.
For any star the velocity relative to the Sun is a reflection of the Solar Motion i.e. the motion of the Sun in space. The solar motion depends in a simple systematic way on the type of star used. As a result, it is possible to define a local standard of rest (LSR) against which the velocity of all stars, including the Sun, can be referenced.
If we let the solar velocity vector be v0 and the velocity of the kth star in a sample of stars of similiar spectral type be vk then the radial velocity (i.e. the velocty along the line-of-sight to the star from the Sun) is
VR = xk. vk - v0 cos φ
where φ is the angle between the velocity vectors and xk is the unit vector (along the vector from the Sun to the star).
Averaged over a sufficient number of stars near to each other on the sky, the first term vanishes and the solar motion is
<VR> = -v0cos φ
Thus, the average radial velocity of stars will be smallest in the direction in which the Sun is moving (called the Solar Apex), and largest in the opposite direction (the Solar antapex).
A similiar result holds for stellar proper motions (the angular movement of stars on the plane of the sky). In this case the average proper motion of stars is minimised in the directions of the apex and antapex, while they are maximised along the great circle which is perpendicular to the solar motion.
Dehnen and Binney have analysed the Hipparcos data and determined the solar motion and local kinematics in MNRAS, vol. 298, 387. Firstly, they take the Hipparcos CMD and isolate the main sequence stars:
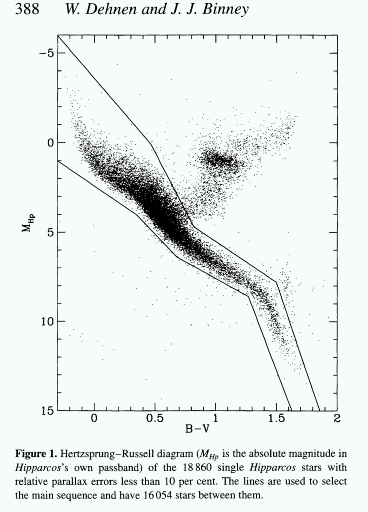
Having isolated the main sequence stars, the solar motion is determined as a function of the colour of the reference stars, binned a few hundred stars at a time:
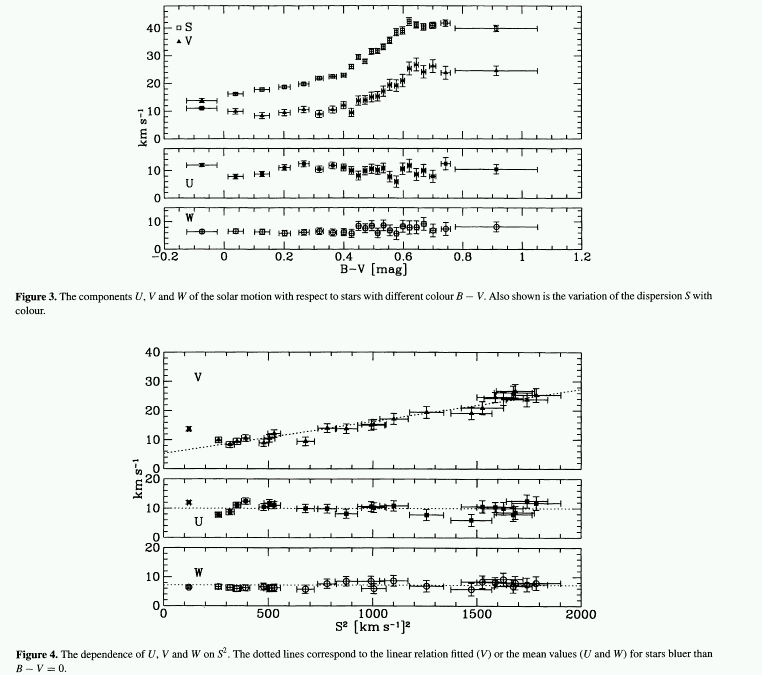
Above (figure 3) you can see how the motion of the Sun in (U, V and W) depends on the colours of the reference stars. In U and W the solar velocity is constant as a function of the colour. Hence, in the two corresponding directions (X and Z) there is no difference in the systematic motion of stars relative to the Sun as a function of colour. The story is different in the V velocity (i.e. in the direction of Galactic rotation).
Colour in this diagram is most readily interpreted as age, since blue stars are young, and red stars are mostly (but not all) old. In the V-velocity there is a systematic increase in the motion of stars as a function of colour - with the redder (older) stars moving more slowly around the center of the Galaxy than the Sun does while the bluer stars move more rapidly. Figure 3 also shows the velocity dispersion of the stars as a function of colour.
This change in the circular velocity of stars near the Sun is called the assymetric drift. Its consequence is that stars younger than the Sun tend to moving forward past the Sun in its orbit, while the Sun itself is able to overtake older stars, as they all participate in their near circular motion around the Galactic center. We'll see this when we start to compute stellar orbits for ourselves.
There is a simple explanation for this effect. Young stars are born from the gas layer, which is very thin and is the most rapidly rotating part of the disk. As the young clusters in which the stars form dissolve, and the stars move into the general gravitational field of the disk, they encounter gas clouds and spiral arms which are able to change their orbits slightly with each encounter.
Encounters tend to redirect the kinetic energy of the orbit randomly into the components (U, V, W) which means that the velocity dispersion of stars increases with time, while the circular velocity decreases. This is seen in figure 4. Ignoring the bluest point (there are physical reasons for doing this, as the very bluest stars are so young that they reflect local condidtions only) then one can fit a relation in terms of the velocity dispersion in σ U
Vass = σU2 / (80 km/s)
If we extrapolate this line forward to zero total velocity dispersion S = 0.0 we obtain a standardised value for the motion of the Sun:
V0 = 5.2 +/- 0.6 km/s
For the other two components, the mean motion was independent of the colour (velocity dispersion) of the stars, and can be easily read from the figure 4:
U0 = 10.0 +/- 0.4 km/s
W0 = 7.2 +/- 0.4 km/s.
Hence the total Solar motion in space relative to nearby stars is v0 = sqrt(U02 + V02 + W02) = 13.4 km/s. The vector v0 is directed toward Galactic coordinates l=27, b=57.
The extrapolation to S2 = 0 allows us to define a reference point called the local standard of rest (LSR). Physically, this is the velocity of a closed orbit (a circle around the Galaxy) that passes through the present position of the Sun.
Note that the Sun is moving around the Galactic center slightly faster than the LSR, that it is presently moving inward (here U is defined positive outward from the Galactic center, and finally it is presently moving upward, out of the Galactic plane)
The velocity dispersions increase as a function of colour quite quickly, up to a colour of approx B-V = 0.6. Blueward of this colour all stars are known to be younger than 10 Gyr, the age of the disk, while redward of this colour most stars are older. This is strong evidence that the velocity dispersion increase is related to stellar age.
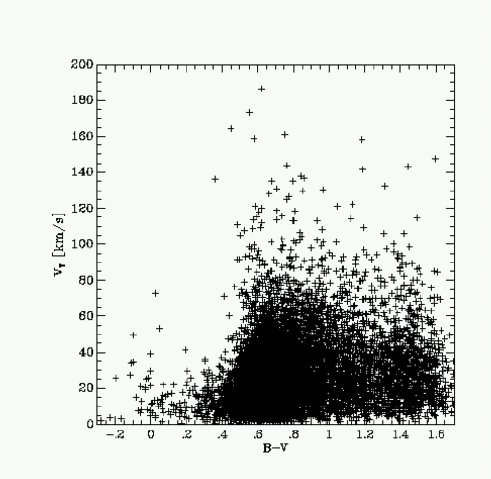
This is shown again above as a scatter plot of the total transverse velocity (on the sky) in km/s as a function of colour for approx 8300 stars in the Hipparcos catalog. There is a very rapid rise in the velocity dispersion as a function of colour up to B-V = 0.6, after which the velocity dispersion remains fairly flat. Notice how very much smaller the velocities of the bluest stars are.
The total velocity dispersion rises from about 15 km/s for the "coldest" stellar populations to 40 km/s for the "hottest". These descriptions in terms of hot and cold are similiar to thinking of the stars as particles in a gas which are sitting in the Galactic gravitational potential. Note however that the "gas" is quite different to a normal gas, since it is collisionless (the stars do not collide with each other).
| Exercise #2: earlier in the course, you put together a spreadsheet of basic data for nearby stars, computing their (X, Y, Z) positions. Now compute "transverse velocities" for your stellar sample, and plot them as a function of colour. Can you reproduce the basic features of the diagram above? |
In the last two lectures we developed a description of the Galactic potential, and a numerical method for calculating the orbits of stars given that we know their initial velocities and positions.
We can start with the Sun. The solar motion is (10, 5, 7) km/s relative to the LSR. In module 4 we developed a model Galaxy for which we can compute the local standard of rest (LSR) exactly --- it is the velocity a star should have at 8 kpc from the Galactic center to move in a circular orbit. This turns out to be 228.5 km/s in that particular model.
We therefore set the Sun's velocity components to V = (-10, 234, 7) and place it at the spatial position (8000,0,5) pc, i.e. we have put the Sun at
X0 = 8000 pc
Y0 = 0 pc
Z0 = 5 pc
and
U0 = -10 km/s
(i.e. moving inward)
V0 = 234
km/s (i.e. faster than the LSR)
W0 = 7 km/s (i.e
moving upward)
Note the Sun is slightly above the midplane (Z = 0). This has been determined in a straightforward manner from the distribution of nearby stars in Z. Note also that Y0 = 0 by definition.
Here is the Sun's orbit assuming these data:
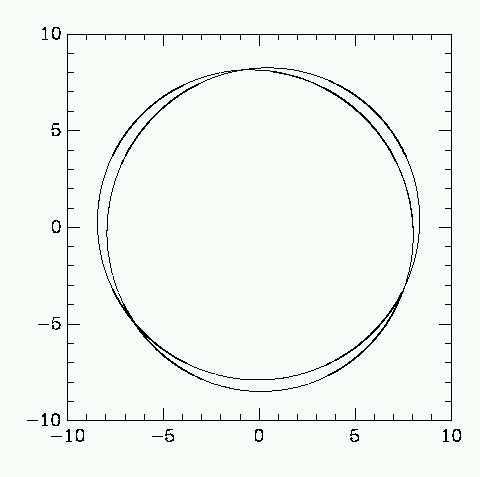
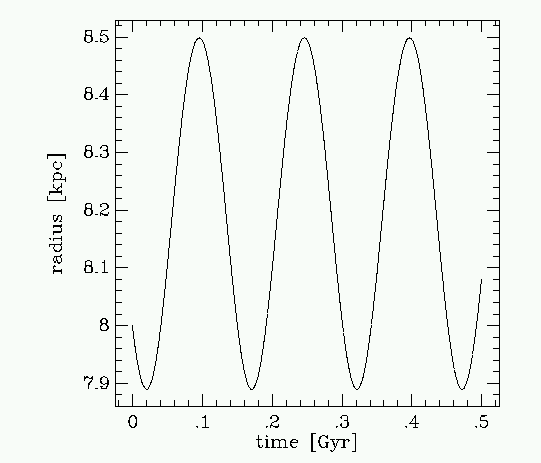
The Sun is very close to perigalacticon, as seen in the next plot, which shows the radius of the orbit as a funtion of time. The orbital radial period is about 150 Myr.
We saw above that the total velocity dispersion of the bluest (youngest)
stars is about 15 km/s. We could place a bunch of stars with velocities
selected to be scattered around the LSR by 15 km/s into the model Galaxy and
examine their orbits. Quicker is to note that to a first approximation there is
about 10 km/s in each of the three components which makes up the total velocity
dispersion. We can get a quick idea of the orbits by placing stars at the
corners of a 20 km/s box in velocity space:
|
Star number
|
U
|
V
|
W
|
|
1
|
10
|
10
|
10
|
|
2
|
-10
|
10
|
10
|
|
3
|
10
|
-10
|
10
|
|
4
|
-10
|
-10
|
10
|
|
5
|
0
|
0
|
0
|
and we have thrown in one star at the LSR and in the center of the box for good measure. We have set W = 10, noting that in the (X,Y) plane orbits with W=10 or W=-10 will look the same.
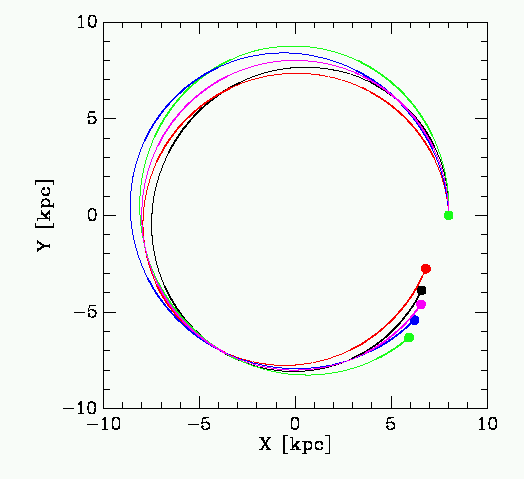
The orbits remain relatively close to circular, although they spread out over a few kiloparsecs. Even quite slow speeds relative to the Sun can send stars off well outside the "Solar neighbourhood", which is generally thought of as being stars within a few hundred parsecs. You can also see that even with a small velocity dispersion initially, the stars spread out in azimuthal angle significantly after just one orbit. After about 1 Gyr, young stars starting at any particular point become spread in phase angles right around the Galactic disk (this is called phase wrapping).
The interesting thing to note here is that stars in the "Solar Neighbourhood" have made their way to us from a range of Galactocentric distances and phase angles --- what we are effectively doing is sampling the properties of stars in an annulus in the Galactic disk, rather than just a small sphere near the Sun.
For the "hottest" stellar types the velocity dispersions come out to around (40, 25, 20) km/s. We can place stars at the corners of our box again (this time the box is a prism in velocity space rather than a cube as with the young stars).
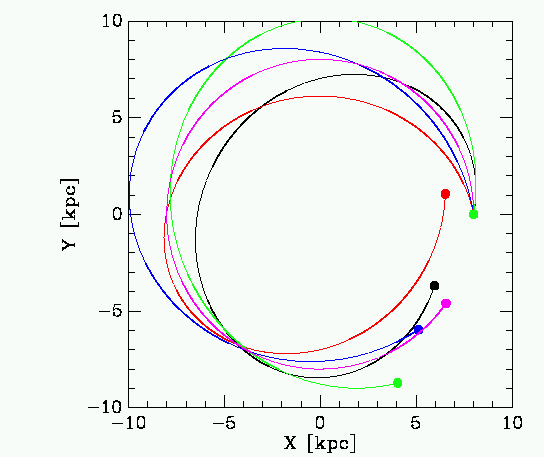
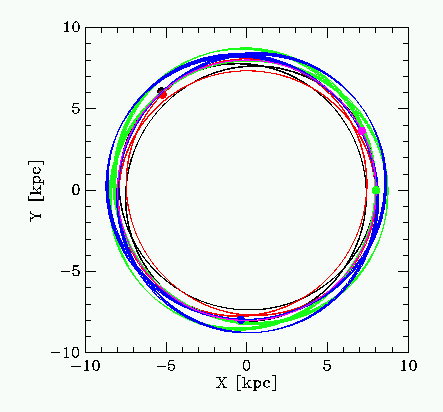 |
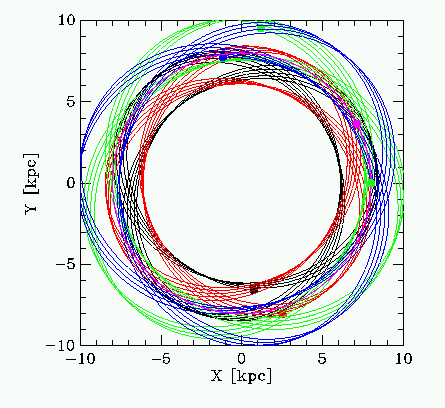 |
An important extra aspect to local stellar velocity space is that the distribution of velocities is by no means smooth. There are quite a few prominant bumps, particularly in the 2-D velocity distribution in the plane.
A fraction of stars are born in open clusters where the velocity dispersion of the stars is very small, of order a few km/s. This is a small enough velocity dispersion that after the stars have drifted apart, and their nature as a group is no longer obvious because of the physical concentration in space, nevertheless the velocities of the stars remain very similiar. Such groups, wrapped around the disk, are called stellar streams or moving groups and appear as overdensities in nearby velocity space. There are 4 or 5 clear moving groups nearby the Sun and probably quite a few more which are difficult to recognise without more accuate velocity information. Moving groups show up as peaks in the distribution of velocities of stars near the Sun, as seen below. Stars have been divided by colour in the plots, moving from bluest (and most likely youngest) to older and redder stars.
Source: Dehnen 1998
Groups : B1 B-V < 0 : B2 0.0 < B-V < 0.4 : B3 0.4 < B-V < 0.6 : B4 B-V 0.6 : G Giants : AL All stars
A galactic orbital integrator is at http://www.astro.utu.fi/galorb.html
The integrator calculates stellar orbits for 2 Gyr, printing out results every 10 million years.
Here are some exercises to try: