Source : http://antwrp.gsfc.nasa.gov/apod/ap980523.html.
Credit: Knut Lundmark (Copyright: Lund Observatory) Further Info
http://www.astro.lu.se/Resources/Vintergatan/
The image above is not a photo, but a painting completed in the 1950's at Lund Observatory under the supervision of Knut Lundmark. It shows the visible (optical) Milky Way over the whole sky plus about 7000 stars. The faint stars along the Milky Way are too faint and densely packed to be seen individually -- rather the Milky Way appears as a sheet of light across the sky, broken up by dark patches (which are now known to be due to intervening dust blocking stars in the background).
The flattened structure was apparently clear enough to the Ancients who conjectured that the milky band of stars which runs in a strip a few degrees wide right across the splashed from the breast of the sleeping goddess Hera. As a consequence many European languages refer to it as the Milky Way, although noteable exceptions are Finnish ("Bird's flightpath") and Swedish ("The Winter Street"). The Greeks actually termed it ``galaxias kuklos'' (``milky circle''), and this is also the source for the word "galaxy". There are many names for our home galaxy!
After the invention of the telescope it emerged that the Milky Way was composed of millions of faint stars. In the 18th century, the German/English astronomer William Herschel (1738-1822) began a series of "starcounts" in which the number of stars as a function of magnitude in various directions on the sky were determined. Herschel conlcuded that the Sun is in the center of a disk-like system, with a thickness about 1/6th of its diameter. Astronomy was dominated by residents of the Northern Hemisphere, and it is hard not to imagine that his conclusion would have been quite different if he had seen the sky from the equator or further into the southern hemisphere. In the south, the increased thickness and brightness of the central regions of the Milky Way are clear to the naked eye as Sagittarius passes overhead on summer nights. His son, John Herschel (1792 - 1871) , who had traveled to South Africa, wrote in 1849 that the Galaxy must be considered "a flat ring of immense and irregular bredth and thickness, within which we are excentrically situated, nearer to the southern than to the northern part of its circuit" (quoted in The Milky Way as a galaxy by G. Gilmore, Saas-Fee Lectures, 1989). Nevertheless, this view did not become the received one until well into the 20th century.
It was in the early 20th century that the Dutch astronomer Jacobus Kapteyn (1851-1922) who counted stars on photographic plates in a set of "selected regions". He found that there were about equal numbers of stars along the Galactic plane no matter where he looked, and concluded that if there is nothing intervening (dust) then we must be at the center of the stellar system. This became known as Kapteyn's Universe.
There was a major debate at the time in Astronomy, which concerned the nature of the faint nebulae. There were several hundred faint "fuzzy patches" known, around the sky, but it was not known whether they were within the Milky Way or external to it. The matter led to the "Great Debate" in 1920, between Harlow Shapley (1885-1972) and Heber D. Curtis (1872-1942) . The debate was actually about how big the Universe was. Curtis argued that the faint nebulae where further examples of stellar systems like the Milky Way, while Shapley argued that instead they were light-emitting gas clouds within the Galaxy. Both men were right --- and wrong, since both kinds of nebulae exist! Edwin Hubble (1889-1953) resolved the matter a few years later when large enough telescopes had been built that the individual (Cepheid) stars in some of the "nebulae" (now called galaxies) could be resolved.
Several other
discoveries led to Kapteyn's Universe being discarded. Firstly, there
was the discovery that the dark clouds along the Milky Way
really are caused by absorption of light by material (dust) in space,
and secondly the work of Shapley who noticed that the Globular
Clusters are preferentially concentrated toward Sagittarius, the
center of the Galaxy. By the late 1950's (at the Vatican Conference on
stellar populations) a view of the Galaxy's visible structure had
emerged which is very similiar to that of today.
Source http://adc.gsfc.nasa.gov/mw/milkyway.html
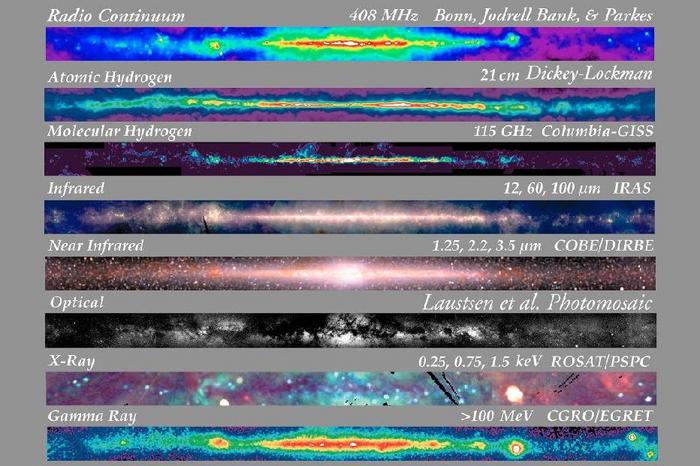
The images above show views
of the Milky Way along the Galactic plane over wavelengths from Radio to
Gamma.
 |
Radio map at 408 Mhz, showing mainly emission due to scattering of free electrons in the interstellar plasma (i.e. hot gas). The large arc is due to a nearby supernova remnant. |
 |
21 cm radiation map, showing the distribution of neutral Hydrogen gas in the galactic disk, and a few nearby arcs from recent supernovae. |
 |
Distribution of H2, or molecular Hydrogen.This maps the "cold" gas in the Galaxy, from which stars will eventually form. The actual observed molecule is CO, rather than H2, which is very difficult to detect directly. The star forming layer of gas is remarkably thin. |
 |
Infrared maps at the wavelengths 12, 60 and 100 microns. Infrared emission predominately comes from interstellar dust which is "warmed" to a f ew 10s of degrees Kelvin by the ambient radiation field of the Galaxy's stars. |
 |
Near Infrared emission is dominated by cool stars. Since these are typically either old or long-lived stars, this is our best view of the Galaxy with the hot, bright young stars removed. Dust absorption at these wavelengths is very low and we get a clear view all the way to the Galactic center of the disk and bulge. |
 |
Optical imageof the Galaxy showing the huge effects that dust absorption has on our view of the central regions of the Galaxy. The emission is dominated by young and old stars and by the effects of dust. |
 |
X-ray image taken by the Rosat satellite. This view, less clear than the others is dominated by supernova remnants (some of the arclike features) as well as individual sources of X-radiation from close binary stars or black hole candidates. |
 |
Egret's Gamma ray view of the Galaxy is dominated by emission from Cosmic Rays (high energy particles) decelerating in the interstellar medium. |

The three major structural elements of the Milky Way are the disk, bulge and stellar halo. The first two of these are beautifully shown in this COBE image of the Milky Way.
The three major components are:
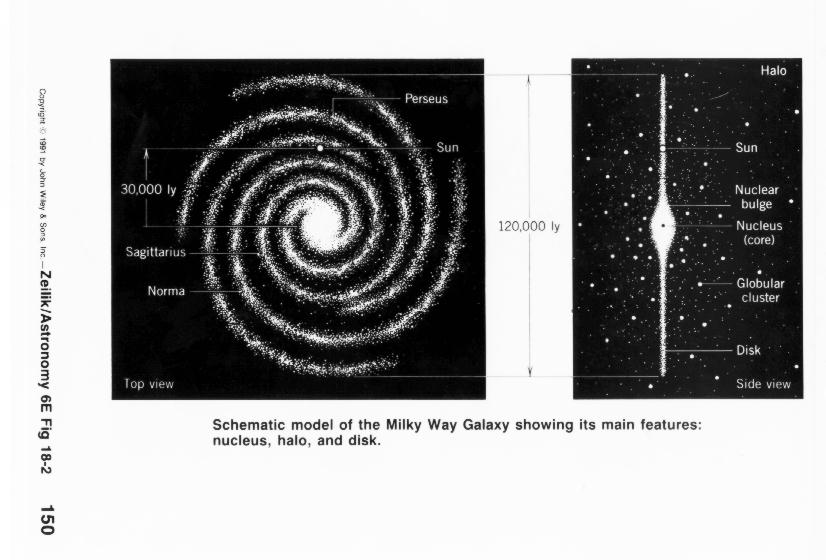
Most of the nearby stars in the Galaxy belong to the disk. The mid-plane of this disk is the Galactic plane, and it is used to define a system of Galactic coordinates (l,b) where l is the Galactic longitude (angle along the plane) and b is the Galactic latitude (angle above the plane). Cartesian (X,Y,Z) Galactic coordinates are defined as
X = cos l cos
b
Y = sin l cos
b
Z = sin b
Physically, X is the direction toward the Galactic center, Y is the direction of Galactic rotation and Z is the direction perpendicular out of the Galactic plane.
The Sun is located at a distance R0 from the galactic center. There are many ways to measure this, and they give answers between about 7 and 9 kpc. The Sun is frequently assumed to be exactly 8 kpc from the center, since this simplifies comparison of the work of different authors.
The disk of the Galaxy rotates and this prevents it from collapsing into the Galactic center. Various determinations of Vrot give values between 190 and 250 km/sec. The rotation speed at the Sun is frequently adopted to be exactly Vrot = 220 km/sec.
The stars in the disk have an exponential distribution of surface brightness (light flux per unit surface area)
I(R) = I0 exp(-R/Rd)
where Rd is called the disk scale length and is about 3.5 +/- 1 kpc (1 kpc = 1000 pc and 1 pc = 3.26 light years = 3.085678 x 1018cm).
 Click for an example of a raw disk galaxy image, straight from a telescope (Danish 1.5 meter at ESO in La Silla, Chile)
In the following table,
the amount of energy radiated by the Sun per second is called the Solar
Luminosity, L0 = 3.86 x 1033 ergs/sec.
The total luminosity of the disk is about 1.2 x 10¹⁰ L0
while the luminosity of the spheroid is about 2 x 10⁹ L0.
The mass of the Sun (Solar mass) is M0 = 1.99 x 1033
g.
| Disk scale length, Rd | 3.5 +/- 1.0 kpc |
| Disk luminosity (I band) | 3 x 10¹⁰ L0 |
| Bulge Luminosity (I band) | 1010 L0 |
| Total Luminosity (I band) | 4 x 10¹⁰ L0 |
| Stellar Disk Mass-to-light ratio (I band) | 1.2 M0 /L0 |
| Disk Mass, Md | 3 x 10¹⁰ M0 |
| Bulge Mass, Mb | 1010 M0 |
| Sun's distance from center, R0 | 8 +/- 1 kpc |
| Rotation speed at the Sun, Vrot | 220 +/- 20 km/sec |
| Hubble type | Sbc |
Before we go to Galactic
Dynamics, we'll review some of the background properties of stars and stellar
systems.
| Spectral Type Temperature Mass range Lifetime |
Comments | ||
| O 60,000-30,000K 20 - 120 MO 105 - 106 years | The hottest, youngest and most massive of all the stars. They also have the shortest lifetimes, and are found in young stellar associations. Supernovae from these stars are responsible for enriching the Interstellar Medium (i.e. the gas and dust found between the stars) with elements produced during stellar "evolution" (i.e. the changes in structure and composition which occur from star birth to star death. | ||
| B 30,000-10,000 K 20 - 3 MO 108 years |
Short lived, hot stars, generally confined to a thin layer in the Galactic disk. | ||
| A 10,000-7,500 K 3 - 1.5 MO 0.5-1x10⁹ years |
A stars are typically younger than a few x109 years, andas such are part of the "Young disk", i.e. a thin layer of stars close to the Galactic plane (along with O and B stars). | ||
| F 7,500-6,000 K 1.5 - 1 MO 1010 years |
F stars can be quite long lived (of order the age of the Galaxy), but will generally be younger. The processes of stellar evolution make age measurements possible (a property they share with many G stars). | ||
| G 6,000-5,000 K 1 - 0.8 MO few-1010 years |
Long lived stars, with ages of order the Galaxy's age. G, K and M stars form the bulk of the Galactic disk (about 75% by mass). | ||
| K 5,000-3,500 K 0.8 - 0.5 MO >1010 years |
Cool stars, which are "burning" their Hydrogen slowly (burning here refers to the conversion of Hydrogen into Helium). All K and M dwarfs formed during the Galaxy's lifetime are still on the main sequence, unlike hotter (OBAFG) stars | ||
| M 3,500-2,000? K 0.5 - 0.08 MO >1011 years |
Very cool, dim stars, and very common. Most of the Galaxy's stars are M dwarfs. | ||
| Brown Dwarfs < approx 2,000 K < 0.08 MO >>1011 years |
Only recently found after searches lasting many decades, these are not actually "stars" since they do not burn Hydrogen. Their space density is believed to be quite low, and they are probably heavily outnumbered by M dwarfs. | ||
The different spectral
types reflect the temperature/mass of the stars. The relative flux
distributions as a function of spectral type is shown below. The
colours represent : O stars - black, B stars- red, A stars- green, F
stars - blue, G stars - purple, K stars - yellow and M stars -
grey. (N.B. All spectra normalised to 1.0 at 5500
Angstroms).
Young hot stars are blue,
cool stars are red -- as can be easily seen in the enormous difference
in the amount of blue versus red light put out by stars of different spectra
type. The peak in the energy distribution of O + B stars is well into the
ultra-violet, while for M stars it is well into the infra-red (off to the
left and right respectively on the lower scale). For G type stars like
the Sun it peaks just about where our eyes are most sensitive to photons.
Note that the spectral distributions shown above are for a star observed
outside of the Earth's atmosphere --- the atmosphere can change the distribution
markedly in the UV and IR.